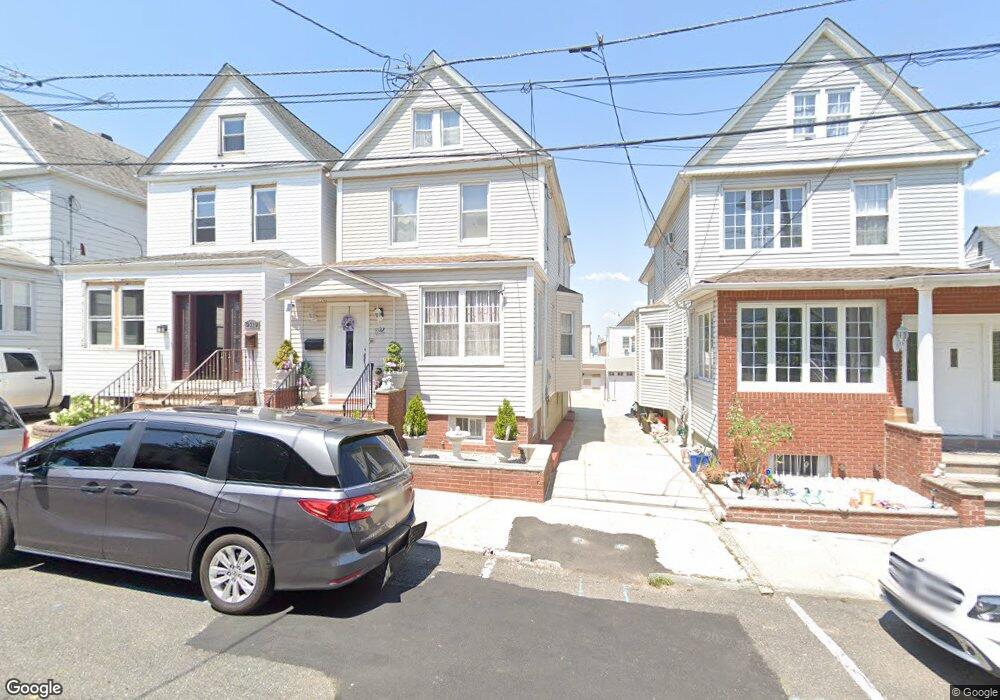
9121 Durham Ave North Bergen, NJ 07047
Estimated Value: $548,000 - $626,000
--
Bed
--
Bath
1,720
Sq Ft
$340/Sq Ft
Est. Value
About This Home
This home is located at 9121 Durham Ave, North Bergen, NJ 07047 and is currently estimated at $584,555, approximately $339 per square foot. 9121 Durham Ave is a home located in Hudson County with nearby schools including North Bergen High School and Our Lady of Grace School.
Ownership History
Date
Name
Owned For
Owner Type
Purchase Details
Closed on
Apr 21, 1998
Sold by
Federal National Mortgage Association
Bought by
Acosta Carlos and Acosta Carmen Atallana
Current Estimated Value
Home Financials for this Owner
Home Financials are based on the most recent Mortgage that was taken out on this home.
Original Mortgage
$72,000
Interest Rate
7.04%
Purchase Details
Closed on
Sep 15, 1997
Sold by
Cassidy Joseph T
Bought by
Federal National Mortgage Association
Home Financials for this Owner
Home Financials are based on the most recent Mortgage that was taken out on this home.
Original Mortgage
$132,168
Interest Rate
7.23%
Purchase Details
Closed on
Jul 27, 1995
Sold by
Mederos Miriam and Castillo Md Juan
Bought by
Moran Luis and Valle Mario A
Purchase Details
Closed on
Jan 18, 1994
Sold by
Citibank
Bought by
Mederos Miriam and Castillo Juan
Create a Home Valuation Report for This Property
The Home Valuation Report is an in-depth analysis detailing your home's value as well as a comparison with similar homes in the area
Home Values in the Area
Average Home Value in this Area
Purchase History
| Date | Buyer | Sale Price | Title Company |
|---|---|---|---|
| Acosta Carlos | -- | Fidelity National Title Ins | |
| Federal National Mortgage Association | -- | -- | |
| Moran Luis | $124,750 | Vested Title Inc | |
| Mederos Miriam | $41,000 | -- |
Source: Public Records
Mortgage History
| Date | Status | Borrower | Loan Amount |
|---|---|---|---|
| Closed | Acosta Carlos | $72,000 | |
| Previous Owner | Federal National Mortgage Association | $132,168 |
Source: Public Records
Tax History Compared to Growth
Tax History
| Year | Tax Paid | Tax Assessment Tax Assessment Total Assessment is a certain percentage of the fair market value that is determined by local assessors to be the total taxable value of land and additions on the property. | Land | Improvement |
|---|---|---|---|---|
| 2025 | $8,765 | $501,700 | $275,000 | $226,700 |
| 2024 | $8,168 | $501,700 | $275,000 | $226,700 |
| 2023 | $8,168 | $501,700 | $275,000 | $226,700 |
| 2022 | $7,922 | $501,700 | $275,000 | $226,700 |
| 2021 | $10,547 | $180,200 | $50,000 | $130,200 |
| 2020 | $10,329 | $180,200 | $50,000 | $130,200 |
| 2019 | $10,318 | $180,200 | $50,000 | $130,200 |
| 2018 | $10,156 | $180,200 | $50,000 | $130,200 |
| 2017 | $9,967 | $180,200 | $50,000 | $130,200 |
| 2016 | $9,852 | $180,200 | $50,000 | $130,200 |
| 2015 | $9,284 | $180,200 | $50,000 | $130,200 |
| 2014 | $9,192 | $180,200 | $50,000 | $130,200 |
Source: Public Records
Map
Nearby Homes
- 9005 Durham Ave
- 9017 Bergenwood Ave Unit 10
- 9006 Columbia Ave
- 9015 Bergenwood Ave Unit 4
- 8915 Bergenwood Ave Unit 20
- 8915 Bergenwood Ave Unit 14
- 8829 Kennedy Blvd Unit D1
- 426 Hancock Place
- 447 Fairview Ave Unit 304
- 8610 Columbia Ave
- 1204 86th St
- 8804 5th Ave
- 8802 5th Ave
- 411 Sheridan Place
- 9252 Kennedy Blvd Unit 201
- 615 Prospect Ave Unit B
- 615B Prospect Ave
- 1502 85th St
- 46 Grant St
- 652 Prospect Ave
- 9119 Durham Ave
- 9123 Durham Ave
- 9117 Durham Ave
- 9125 Durham Ave
- 9115 Durham Ave
- 9120 Newkirk Ave
- 9122 Newkirk Ave
- 9118 Newkirk Ave
- 9116 Newkirk Ave
- 9124 Newkirk Ave
- 9109 Durham Ave
- 9129 Durham Ave
- 9126 Newkirk Ave Unit 1
- 9126 Newkirk Ave Unit 2
- 9126 Newkirk Ave Unit 2nd Floor
- 9114 Newkirk Ave Unit FIRST FLOO
- 9112 Newkirk Ave Unit 14
- 9112 Newkirk Ave Unit 2ND FLOOR
- 9118 Durham Ave
- 9116 Durham Ave