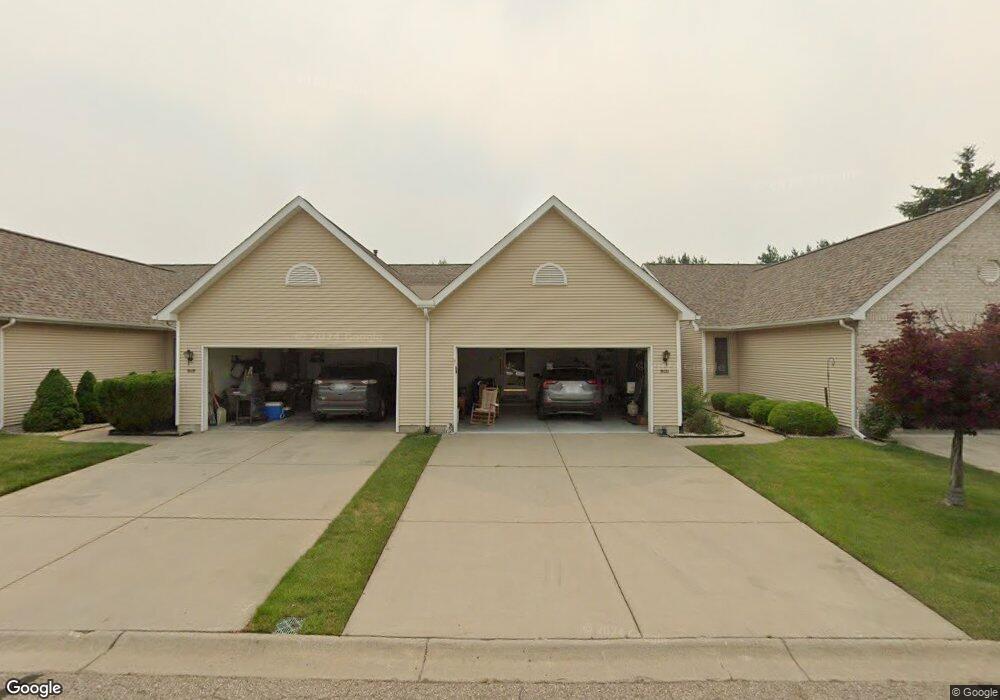
9121 Emily Dr Unit 196 Davison, MI 48423
Estimated Value: $219,691 - $252,000
--
Bed
2
Baths
1,246
Sq Ft
$192/Sq Ft
Est. Value
About This Home
This home is located at 9121 Emily Dr Unit 196, Davison, MI 48423 and is currently estimated at $239,173, approximately $191 per square foot. 9121 Emily Dr Unit 196 is a home located in Genesee County with nearby schools including Thomson Elementary School, Gates Elementary School, and Hill Elementary School.
Ownership History
Date
Name
Owned For
Owner Type
Purchase Details
Closed on
Sep 16, 2024
Sold by
Jarman James T
Bought by
Jarman James T and Jarman Angela L
Current Estimated Value
Purchase Details
Closed on
Sep 10, 2020
Sold by
Jarman James G
Bought by
Jarman Joan M and Jarman Joan
Purchase Details
Closed on
Jul 29, 2015
Sold by
Jarman James G and Jarman Joan M
Bought by
Dockey Carri L and Jarman James T
Purchase Details
Closed on
Jun 30, 2005
Sold by
Devoe Gary L
Bought by
Jarman James G and Jarman Joan M
Purchase Details
Closed on
Dec 3, 2002
Sold by
T L Corp
Bought by
Devoe Gary L
Create a Home Valuation Report for This Property
The Home Valuation Report is an in-depth analysis detailing your home's value as well as a comparison with similar homes in the area
Home Values in the Area
Average Home Value in this Area
Purchase History
| Date | Buyer | Sale Price | Title Company |
|---|---|---|---|
| Jarman James T | -- | None Listed On Document | |
| Jarman James T | $30,000 | None Listed On Document | |
| Jarman James T | $30,000 | None Listed On Document | |
| Jarman Joan M | -- | None Available | |
| Dockey Carri L | -- | Attorney | |
| Jarman James G | $144,000 | Guaranty Title Company | |
| Devoe Gary L | $127,176 | Sargents Title Company |
Source: Public Records
Tax History Compared to Growth
Tax History
| Year | Tax Paid | Tax Assessment Tax Assessment Total Assessment is a certain percentage of the fair market value that is determined by local assessors to be the total taxable value of land and additions on the property. | Land | Improvement |
|---|---|---|---|---|
| 2025 | $2,417 | $91,900 | $0 | $0 |
| 2024 | $660 | $85,200 | $0 | $0 |
| 2023 | $629 | $79,700 | $0 | $0 |
| 2022 | $2,172 | $71,200 | $0 | $0 |
| 2021 | $2,154 | $65,500 | $0 | $0 |
| 2020 | $576 | $70,200 | $0 | $0 |
| 2019 | $566 | $64,300 | $0 | $0 |
| 2018 | $1,830 | $59,400 | $0 | $0 |
| 2017 | $1,757 | $59,400 | $0 | $0 |
| 2016 | $1,726 | $58,000 | $0 | $0 |
| 2015 | -- | $53,600 | $0 | $0 |
| 2012 | -- | $46,400 | $46,400 | $0 |
Source: Public Records
Map
Nearby Homes
- 9223 Lapeer Rd
- 00 Lapeer Rd
- 1120 Crystal Wood Dr
- 0 Lapeer Rd Unit G50060188
- 0 Lapeer Rd Unit G50047586
- 9417 Linda Dr
- 1075 Crystal Wood Dr Unit 24
- 1067 Julie Dr
- 9448 Linda Dr
- 527 Amesbury Dr
- 9469 Parkwood N Unit 2B
- 00 E Lippincott Blvd
- VL E Lippincott Blvd
- 8368 E Lippincott Blvd
- 0 Cal Dr
- 9331 Varodell Dr Unit 1
- 0 Fairway Dr
- 2215 Lily Ct
- 304 S State Rd
- 530 Hemlock Dr
- 9119 Emily Dr Unit 195
- 9125 Emily Dr Unit 197
- 9115 Emily Dr Unit 194
- 9129 Emily Dr Unit 198
- 9109 Emily Dr Unit 193
- 9131 Emily Dr Unit 199
- 9122 Emily Dr
- 9133 Emily Dr Unit 200
- 9133 Emily Dr Unit 9133
- 9105 Emily Dr Unit 192
- 9126 Emily Dr Unit 161
- 9112 Emily Dr Unit 156
- 9112 Emily Dr Unit 74
- 9128 Emily Dr Unit 160
- 9110 Emily Dr Unit 157
- 9103 Emily Dr Unit 191
- 9135 Emily Dr Unit 201
- 9108 Emily Dr Unit 158
- 9108 Emily Dr Unit 74 158
- 9099 Emily Dr Unit 190