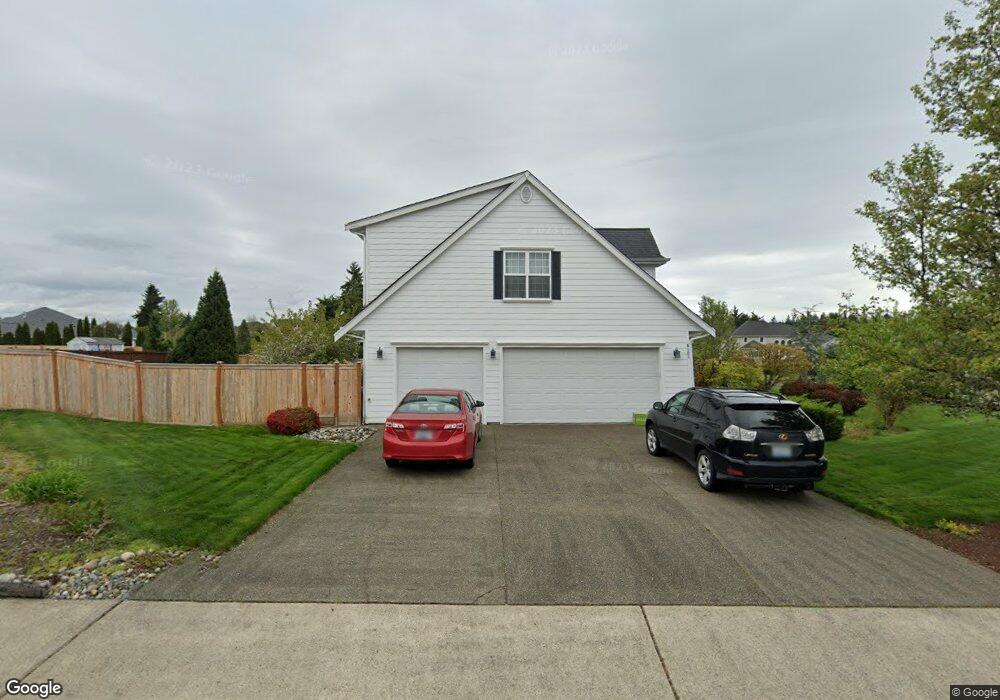
9121 Milburn Loop SE Olympia, WA 98513
The Seasons NeighborhoodEstimated Value: $911,000 - $1,335,000
4
Beds
3
Baths
3,369
Sq Ft
$317/Sq Ft
Est. Value
About This Home
This home is located at 9121 Milburn Loop SE, Olympia, WA 98513 and is currently estimated at $1,069,312, approximately $317 per square foot. 9121 Milburn Loop SE is a home located in Thurston County with nearby schools including Evergreen Forest Elementary School, Nisqually Middle School, and River Ridge High School.
Ownership History
Date
Name
Owned For
Owner Type
Purchase Details
Closed on
Mar 17, 2003
Sold by
Signature Custom Homes Inc
Bought by
Smith Matthew and Smith Kimberly
Current Estimated Value
Home Financials for this Owner
Home Financials are based on the most recent Mortgage that was taken out on this home.
Original Mortgage
$347,200
Outstanding Balance
$148,607
Interest Rate
5.82%
Estimated Equity
$920,705
Purchase Details
Closed on
Jun 27, 2002
Sold by
Mcallister Park Associates Llc
Bought by
Signature Custom Homes Inc
Create a Home Valuation Report for This Property
The Home Valuation Report is an in-depth analysis detailing your home's value as well as a comparison with similar homes in the area
Home Values in the Area
Average Home Value in this Area
Purchase History
| Date | Buyer | Sale Price | Title Company |
|---|---|---|---|
| Smith Matthew | $434,000 | Transnation Title Insurance | |
| Signature Custom Homes Inc | -- | Transnation Title Insurance |
Source: Public Records
Mortgage History
| Date | Status | Borrower | Loan Amount |
|---|---|---|---|
| Open | Smith Matthew | $347,200 | |
| Closed | Smith Matthew | $86,800 |
Source: Public Records
Tax History Compared to Growth
Tax History
| Year | Tax Paid | Tax Assessment Tax Assessment Total Assessment is a certain percentage of the fair market value that is determined by local assessors to be the total taxable value of land and additions on the property. | Land | Improvement |
|---|---|---|---|---|
| 2024 | $8,507 | $916,300 | $280,100 | $636,200 |
| 2023 | $8,507 | $880,500 | $282,700 | $597,800 |
| 2022 | $8,875 | $854,300 | $163,800 | $690,500 |
| 2021 | $8,085 | $753,800 | $152,600 | $601,200 |
| 2020 | $7,487 | $640,000 | $144,000 | $496,000 |
| 2019 | $6,539 | $610,000 | $148,300 | $461,700 |
| 2018 | $7,444 | $541,700 | $116,500 | $425,200 |
| 2017 | $6,853 | $519,750 | $97,750 | $422,000 |
| 2016 | $6,686 | $479,300 | $110,600 | $368,700 |
| 2014 | -- | $497,700 | $105,600 | $392,100 |
Source: Public Records
Map
Nearby Homes
- 2131 Huntington Loop SE
- 9032 22nd Way SE
- 9148 Bedington Dr SE
- 2532 Acer Loop SE
- 2530 Acer Loop SE
- 2526 Acer Loop SE
- 2524 Acer Loop SE
- 2538 Acer Loop SE
- 8705 Fenwick Loop SE
- 9245 Nootka Ct SE
- 2541 Acer Loop SE
- 2635 Acer Loop SE
- 8711 Fenwick Loop SE
- 2631 Acer Loop SE
- 2617 Acer Loop SE
- 9440 Piperhill Dr SE
- 2612 Acer SE
- 2626 Acer Loop SE
- 2624 Acer Loop SE
- 1436 Farina Loop SE
- 9136 Milburn Loop SE
- 9141 Milburn Loop SE
- 9128 Milburn Loop SE
- 9142 Milburn Loop SE
- 9204 Overton Ct SE
- 9120 Milburn Loop SE
- 2137 Huntington Loop SE
- 9205 Milburn Loop SE
- 2143 Huntington Loop SE
- 9125 Piperhill Dr SE
- 9135 Piperhill Dr SE
- 2125 Huntington Loop SE
- 9206 Milburn Loop SE
- 9145 Piperhill Dr SE
- 6215 Piperhill Dr SE
- 9210 Overton Ct SE
- 2119 Huntington Loop SE
- 2149 Huntington Loop SE
- 9211 Milburn Loop SE
- 9216 Milburn Loop SE