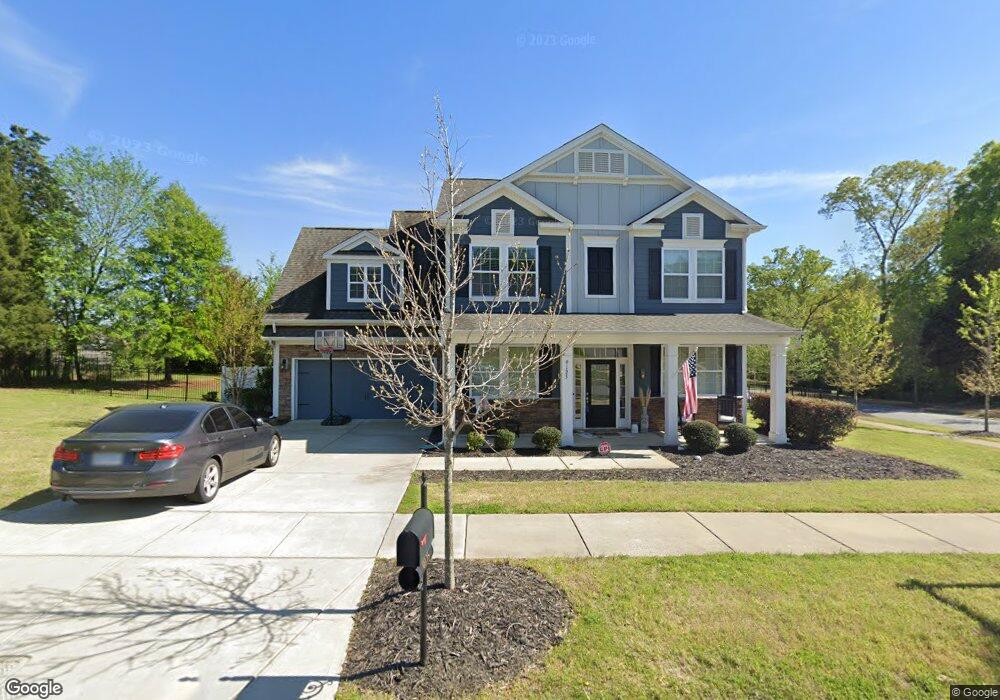
9125 Rayneridge Dr Unit 1178 Huntersville, NC 28078
Estimated Value: $594,000 - $605,028
5
Beds
4
Baths
3,098
Sq Ft
$193/Sq Ft
Est. Value
About This Home
This home is located at 9125 Rayneridge Dr Unit 1178, Huntersville, NC 28078 and is currently estimated at $599,007, approximately $193 per square foot. 9125 Rayneridge Dr Unit 1178 is a home located in Mecklenburg County with nearby schools including Barnette Elementary School, Francis Bradley Middle School, and Hopewell High.
Ownership History
Date
Name
Owned For
Owner Type
Purchase Details
Closed on
Apr 14, 2023
Sold by
Cora Sabrina
Bought by
Gonzalez Esteban and Gonzalez Rachel
Current Estimated Value
Home Financials for this Owner
Home Financials are based on the most recent Mortgage that was taken out on this home.
Original Mortgage
$447,700
Outstanding Balance
$431,155
Interest Rate
5%
Mortgage Type
Construction
Estimated Equity
$167,852
Purchase Details
Closed on
Dec 17, 2020
Sold by
Hester Sara and Hester Sabrinia
Bought by
Hester Sabrina Jasmin
Home Financials for this Owner
Home Financials are based on the most recent Mortgage that was taken out on this home.
Original Mortgage
$285,000
Interest Rate
2.8%
Mortgage Type
New Conventional
Purchase Details
Closed on
Aug 10, 2018
Sold by
D R Horton Inc
Bought by
Hester Sara and Hester Sabrinia
Home Financials for this Owner
Home Financials are based on the most recent Mortgage that was taken out on this home.
Original Mortgage
$284,000
Interest Rate
4.5%
Mortgage Type
New Conventional
Create a Home Valuation Report for This Property
The Home Valuation Report is an in-depth analysis detailing your home's value as well as a comparison with similar homes in the area
Home Values in the Area
Average Home Value in this Area
Purchase History
| Date | Buyer | Sale Price | Title Company |
|---|---|---|---|
| Gonzalez Esteban | $550,000 | None Listed On Document | |
| Hester Sabrina Jasmin | -- | Chicago Title | |
| Hester Sara | $356,000 | None Available |
Source: Public Records
Mortgage History
| Date | Status | Borrower | Loan Amount |
|---|---|---|---|
| Open | Gonzalez Esteban | $447,700 | |
| Previous Owner | Hester Sabrina Jasmin | $285,000 | |
| Previous Owner | Hester Sara | $284,000 |
Source: Public Records
Tax History Compared to Growth
Tax History
| Year | Tax Paid | Tax Assessment Tax Assessment Total Assessment is a certain percentage of the fair market value that is determined by local assessors to be the total taxable value of land and additions on the property. | Land | Improvement |
|---|---|---|---|---|
| 2025 | $3,786 | $504,100 | $125,000 | $379,100 |
| 2024 | $3,786 | $504,100 | $125,000 | $379,100 |
| 2023 | $3,346 | $484,900 | $125,000 | $359,900 |
| 2022 | $2,995 | $330,200 | $75,000 | $255,200 |
| 2021 | $2,978 | $330,200 | $75,000 | $255,200 |
| 2020 | $2,953 | $330,200 | $75,000 | $255,200 |
| 2019 | $2,947 | $330,200 | $75,000 | $255,200 |
| 2018 | $3,247 | $277,900 | $40,000 | $237,900 |
| 2017 | $3,210 | $277,900 | $40,000 | $237,900 |
| 2016 | $3,207 | $88,100 | $40,000 | $48,100 |
| 2015 | $1,076 | $40,000 | $40,000 | $0 |
| 2014 | $448 | $0 | $0 | $0 |
Source: Public Records
Map
Nearby Homes
- 9028 Krestridge View Dr
- 9304 Rayneridge Dr
- 15925 Foreleigh Rd
- 13723 Baytown Ct
- 6434 Myston Ln
- 6412 Myston Ln
- 7006 Garden Hill Dr
- 9104 Cantrell Way
- 9619 Rayneridge Dr
- 6901 Dunton St
- 5112 Ingleburn Ln
- 11510 Grenfell Ave
- 8017 Baylis Dr
- 7334 Henderson Park Rd
- 11110 Grenfell Ave
- 8712 Cool Meadow Dr
- Atwater Plan at Overbrook Estates - Elmspring Collection
- Beckham II Plan at Overbrook Estates - Dogwood Collection
- Ashdale Plan at Overbrook Estates - Ashleaf Collection
- Nora II Plan at Overbrook Estates - Ashleaf Collection
- 9125 Rayneridge Dr Unit 210
- 9125 Rayneridge Dr Unit 112
- 9125 Rayneridge Dr Unit 1186
- 9125 Rayneridge Dr
- 14020 Baytown Ct
- 9115 Rayneridge Dr
- 14016 Baytown Ct
- 9111 Rayneridge Dr
- 9124 Rayneridge Dr
- 9116 Rayeridge Dr
- 9202 Rayeridge Dr
- 9202 Rayneridge Dr
- 9122 Krestridge View Dr Unit 214
- 9122 Krestridge View Dr
- 9126 Krestridge View Dr
- 9105 Rayneridge Dr Unit 207
- 9105 Rayneridge Dr
- 9118 Krestridge View Dr
- 9208 Rayneridge Dr
- 9112 Krestridge View Dr