9126 170th St E Puyallup, WA 98375
Estimated Value: $588,000 - $602,000
4
Beds
3
Baths
2,023
Sq Ft
$294/Sq Ft
Est. Value
About This Home
This home is located at 9126 170th St E, Puyallup, WA 98375 and is currently estimated at $594,789, approximately $294 per square foot. 9126 170th St E is a home located in Pierce County with nearby schools including Brouillet Elementary School, Stahl Junior High, and Gov. John Rogers High School.
Ownership History
Date
Name
Owned For
Owner Type
Purchase Details
Closed on
Mar 2, 1998
Sold by
Hoover Cloyes R
Bought by
Stanford William B and Stanford Carol R
Current Estimated Value
Home Financials for this Owner
Home Financials are based on the most recent Mortgage that was taken out on this home.
Original Mortgage
$152,240
Outstanding Balance
$27,556
Interest Rate
6.9%
Estimated Equity
$567,233
Purchase Details
Closed on
Oct 17, 1994
Sold by
Sound Built Homes Inc
Bought by
Hoover Cloyes R and Hoover Cheryl G
Home Financials for this Owner
Home Financials are based on the most recent Mortgage that was taken out on this home.
Original Mortgage
$144,330
Interest Rate
8.54%
Mortgage Type
Assumption
Purchase Details
Closed on
Nov 19, 1993
Sold by
Tucci & Sons Inc
Bought by
Sound Built Homes Inc
Home Financials for this Owner
Home Financials are based on the most recent Mortgage that was taken out on this home.
Original Mortgage
$124,400
Interest Rate
7.21%
Create a Home Valuation Report for This Property
The Home Valuation Report is an in-depth analysis detailing your home's value as well as a comparison with similar homes in the area
Home Values in the Area
Average Home Value in this Area
Purchase History
| Date | Buyer | Sale Price | Title Company |
|---|---|---|---|
| Stanford William B | $156,950 | -- | |
| Hoover Cloyes R | $141,500 | -- | |
| Sound Built Homes Inc | -- | Chicago Title Insurance Co |
Source: Public Records
Mortgage History
| Date | Status | Borrower | Loan Amount |
|---|---|---|---|
| Open | Stanford William B | $152,240 | |
| Previous Owner | Hoover Cloyes R | $144,330 | |
| Previous Owner | Sound Built Homes Inc | $124,400 |
Source: Public Records
Tax History Compared to Growth
Tax History
| Year | Tax Paid | Tax Assessment Tax Assessment Total Assessment is a certain percentage of the fair market value that is determined by local assessors to be the total taxable value of land and additions on the property. | Land | Improvement |
|---|---|---|---|---|
| 2025 | $5,195 | $529,600 | $174,000 | $355,600 |
| 2024 | $5,195 | $513,200 | $180,700 | $332,500 |
| 2023 | $5,195 | $488,900 | $180,700 | $308,200 |
| 2022 | $5,155 | $507,300 | $180,700 | $326,600 |
| 2021 | $4,897 | $378,600 | $130,100 | $248,500 |
| 2019 | $4,390 | $355,900 | $114,600 | $241,300 |
| 2018 | $4,409 | $323,800 | $99,100 | $224,700 |
| 2017 | $4,108 | $296,700 | $86,900 | $209,800 |
| 2016 | $3,772 | $246,800 | $68,700 | $178,100 |
| 2014 | $3,276 | $229,500 | $55,900 | $173,600 |
| 2013 | $3,276 | $205,500 | $49,500 | $156,000 |
Source: Public Records
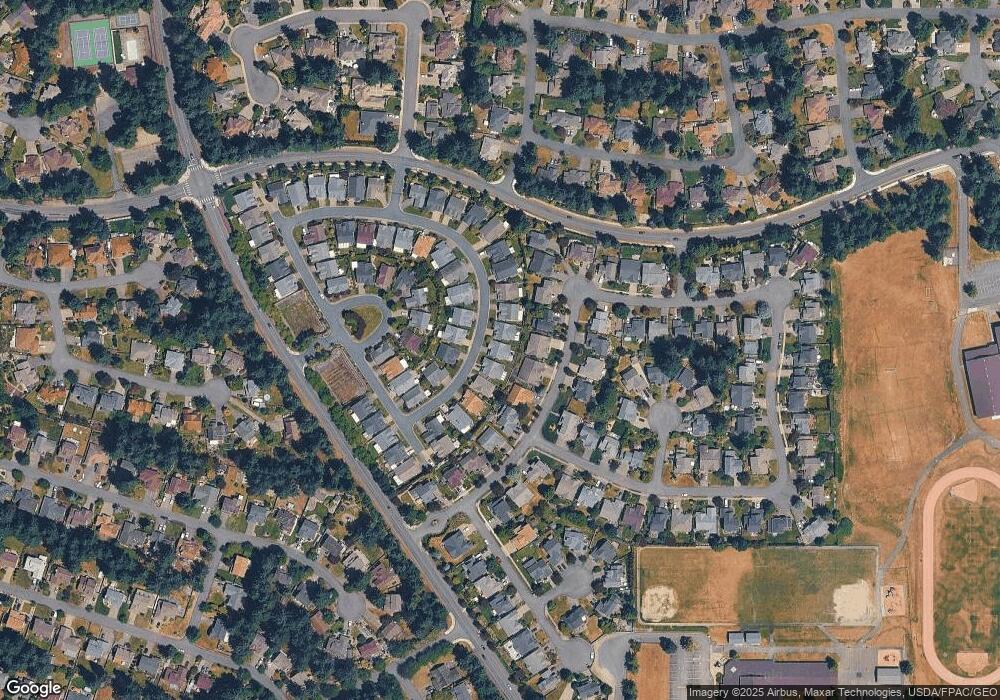
Map
Nearby Homes
- 9305 172nd St E
- 17217 92nd Ave E
- 9303 169th St E
- 9115 175th Street Ct E
- 17317 94th Avenue Ct E
- 17114 89th Avenue Ct E
- 9401 167th Street Ct E
- 17525 90th Ave E
- 9022 166th St E
- 7714 166th St E
- 17225 85th Avenue Ct E
- 9311 178th Street Ct E
- 9020 178th Street Ct E
- 8518 167th Street Ct E
- 9608 166th St E
- 17018 84th Avenue Ct E
- 8913 180th Street Ct E
- 8515 166th Street Ct E
- 8612 165th Street Ct E
- 17003 83rd Avenue Ct E
- 9127 170th St E
- 9124 170th St E
- 9818 170th Street Ct E Unit 51
- 9823 170th Street Ct E
- 9910 170th Street Ct E Unit 59
- 9120 170th Street Ct E
- 9123 170th St E
- 9123 170th St E
- 9120 170th St E
- 9120 170th St E Unit CT
- 9115 171st Street Ct E
- 17212 92nd Ave E
- 17214 92nd Ave E
- 9121 170th St E
- 9121 170th Street Ct E
- 17203 92nd Ave E
- 9111 171st Street Ct E
- 9116 170th St E
- 9111 171st Street Ct E
- 17216 92nd Ave E