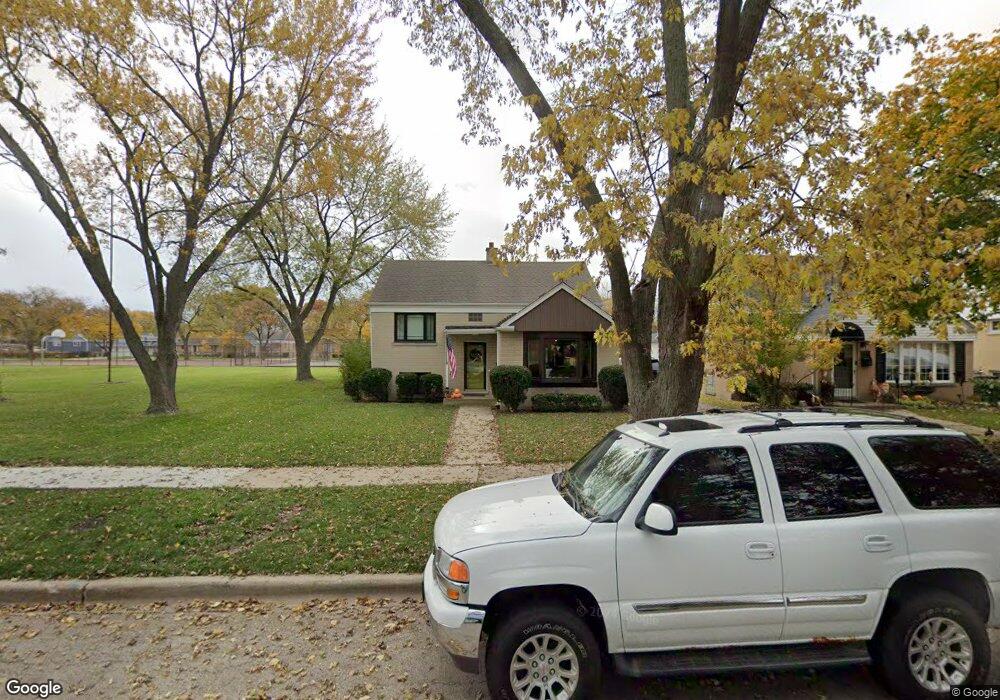
9127 28th St Brookfield, IL 60513
Estimated Value: $329,000 - $394,000
2
Beds
1
Bath
918
Sq Ft
$387/Sq Ft
Est. Value
About This Home
This home is located at 9127 28th St, Brookfield, IL 60513 and is currently estimated at $354,964, approximately $386 per square foot. 9127 28th St is a home located in Cook County with nearby schools including S. E. Gross Middle School, Brook Park Elementary School, and Riverside Brookfield High School.
Ownership History
Date
Name
Owned For
Owner Type
Purchase Details
Closed on
Mar 16, 2011
Sold by
Fannie Mae
Bought by
Fitzgerald Ian
Current Estimated Value
Home Financials for this Owner
Home Financials are based on the most recent Mortgage that was taken out on this home.
Original Mortgage
$151,620
Outstanding Balance
$105,638
Interest Rate
5.09%
Mortgage Type
New Conventional
Estimated Equity
$249,326
Purchase Details
Closed on
Jan 6, 2011
Sold by
Piper
Bought by
Federal National Mortgage Association
Purchase Details
Closed on
Mar 30, 2007
Sold by
Mikes Richard J
Bought by
Piper David I
Home Financials for this Owner
Home Financials are based on the most recent Mortgage that was taken out on this home.
Original Mortgage
$218,000
Interest Rate
6.31%
Mortgage Type
Unknown
Purchase Details
Closed on
Oct 24, 2005
Sold by
Mikes Anna Mae
Bought by
Mikes Anna M and The Anna M Mikes Trust
Create a Home Valuation Report for This Property
The Home Valuation Report is an in-depth analysis detailing your home's value as well as a comparison with similar homes in the area
Home Values in the Area
Average Home Value in this Area
Purchase History
| Date | Buyer | Sale Price | Title Company |
|---|---|---|---|
| Fitzgerald Ian | $160,000 | Git | |
| Federal National Mortgage Association | -- | None Available | |
| Piper David I | $272,500 | Cti | |
| Mikes Anna M | -- | -- |
Source: Public Records
Mortgage History
| Date | Status | Borrower | Loan Amount |
|---|---|---|---|
| Open | Fitzgerald Ian | $151,620 | |
| Previous Owner | Piper David I | $218,000 |
Source: Public Records
Tax History Compared to Growth
Tax History
| Year | Tax Paid | Tax Assessment Tax Assessment Total Assessment is a certain percentage of the fair market value that is determined by local assessors to be the total taxable value of land and additions on the property. | Land | Improvement |
|---|---|---|---|---|
| 2024 | $8,100 | $26,000 | $4,655 | $21,345 |
| 2023 | $7,531 | $26,000 | $4,655 | $21,345 |
| 2022 | $7,531 | $21,494 | $3,990 | $17,504 |
| 2021 | $7,342 | $21,494 | $3,990 | $17,504 |
| 2020 | $7,242 | $21,494 | $3,990 | $17,504 |
| 2019 | $6,384 | $19,617 | $3,657 | $15,960 |
| 2018 | $6,127 | $19,617 | $3,657 | $15,960 |
| 2017 | $5,669 | $19,617 | $3,657 | $15,960 |
| 2016 | $5,179 | $16,411 | $3,325 | $13,086 |
| 2015 | $4,933 | $16,411 | $3,325 | $13,086 |
| 2014 | $4,881 | $16,411 | $3,325 | $13,086 |
| 2013 | $5,534 | $19,433 | $3,325 | $16,108 |
Source: Public Records
Map
Nearby Homes
- 2938 Vernon Ave
- 3108 Oak Ave
- 1245 Morgan Ave
- 3128 Arthur Ave
- 1427 Cleveland Ave
- 1543 Cleveland Ave
- 1518 Cleveland Ave
- 3229 Maple Ave
- 1436 Kemman Ave
- 3251 Grand Blvd
- 2263 S 14th Ave
- 2246 S 18th Ave
- 3336 Grand Blvd
- 9532 Lexington Ave
- 1535 Beach Ave
- 3417 Oak Ave
- 9532 Jackson Ave
- 1427 Homestead Rd Unit H
- 1427 Homestead Rd Unit F
- 3621 Madison Ave