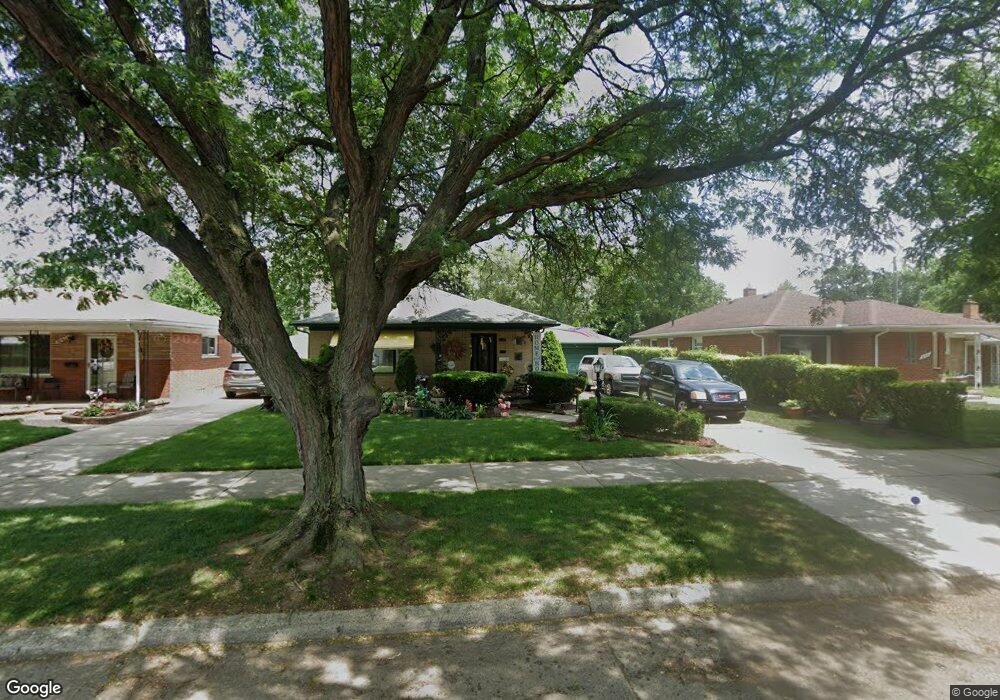
9128 Appleton Redford, MI 48239
Estimated Value: $208,762 - $224,000
Studio
1
Bath
1,339
Sq Ft
$162/Sq Ft
Est. Value
About This Home
This home is located at 9128 Appleton, Redford, MI 48239 and is currently estimated at $216,941, approximately $162 per square foot. 9128 Appleton is a home located in Wayne County with nearby schools including John D. Pierce Middle School, Lee M. Thurston High School, and Global Heights Academy.
Ownership History
Date
Name
Owned For
Owner Type
Purchase Details
Closed on
Jul 26, 2011
Sold by
Nationstar Mortgage Llc
Bought by
Fannie Mae
Current Estimated Value
Purchase Details
Closed on
Jul 20, 2011
Sold by
Talley Crosby and Talley Georgianna C
Bought by
Nationstar Mortgage Llc
Purchase Details
Closed on
Jul 31, 2007
Sold by
Jakuszewski Stephanie and Perkowski Mary Ellen
Bought by
Talley Crosby
Purchase Details
Closed on
Jun 12, 2002
Sold by
Jakuszewski Alphonse J
Bought by
Jakuszewski Nancy
Create a Home Valuation Report for This Property
The Home Valuation Report is an in-depth analysis detailing your home's value as well as a comparison with similar homes in the area
Home Values in the Area
Average Home Value in this Area
Purchase History
| Date | Buyer | Sale Price | Title Company |
|---|---|---|---|
| Fannie Mae | -- | None Available | |
| Nationstar Mortgage Llc | $159,089 | None Available | |
| Talley Crosby | $142,000 | Transnation Title | |
| Jakuszewski Nancy | -- | -- |
Source: Public Records
Tax History
| Year | Tax Paid | Tax Assessment Tax Assessment Total Assessment is a certain percentage of the fair market value that is determined by local assessors to be the total taxable value of land and additions on the property. | Land | Improvement |
|---|---|---|---|---|
| 2025 | $809 | $99,600 | $0 | $0 |
| 2024 | $787 | $88,700 | $0 | $0 |
| 2023 | $754 | $76,600 | $0 | $0 |
| 2022 | $2,213 | $65,500 | $0 | $0 |
| 2021 | $2,150 | $62,800 | $0 | $0 |
| 2020 | $2,121 | $56,600 | $0 | $0 |
| 2019 | $2,075 | $43,100 | $0 | $0 |
| 2018 | $679 | $35,500 | $0 | $0 |
| 2017 | $2,348 | $32,700 | $0 | $0 |
| 2016 | $1,830 | $30,400 | $0 | $0 |
| 2015 | $2,850 | $28,500 | $0 | $0 |
| 2013 | $2,950 | $30,100 | $0 | $0 |
| 2012 | $1,898 | $33,300 | $7,900 | $25,400 |
Source: Public Records
Map
Nearby Homes
Your Personal Tour Guide
Ask me questions while you tour the home.