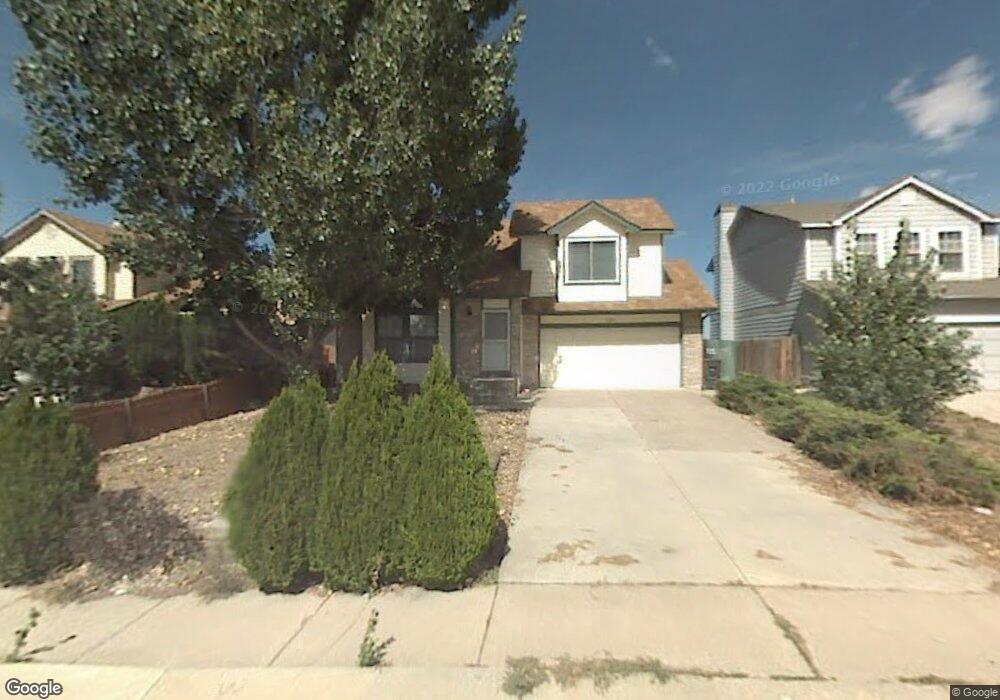
9128 Chieftan Dr Colorado Springs, CO 80925
Colorado Centre NeighborhoodEstimated Value: $362,000 - $380,000
3
Beds
3
Baths
1,482
Sq Ft
$252/Sq Ft
Est. Value
About This Home
This home is located at 9128 Chieftan Dr, Colorado Springs, CO 80925 and is currently estimated at $373,528, approximately $252 per square foot. 9128 Chieftan Dr is a home located in El Paso County with nearby schools including Martin Luther King Jr. Elementary School, Watson Junior High School, and Widefield High School.
Ownership History
Date
Name
Owned For
Owner Type
Purchase Details
Closed on
Sep 22, 2017
Sold by
Nelson Sabine
Bought by
Thomas Marksam Sabine
Current Estimated Value
Purchase Details
Closed on
Feb 26, 2001
Sold by
Nelson Bryan G
Bought by
Nelson Sabine
Home Financials for this Owner
Home Financials are based on the most recent Mortgage that was taken out on this home.
Original Mortgage
$94,300
Interest Rate
7.19%
Purchase Details
Closed on
Feb 9, 1996
Sold by
Allen Shawn D and Allen Karin W
Bought by
Nelson Bryan G and Nelson Sabine
Home Financials for this Owner
Home Financials are based on the most recent Mortgage that was taken out on this home.
Original Mortgage
$101,490
Interest Rate
7.08%
Mortgage Type
VA
Purchase Details
Closed on
Feb 3, 1993
Bought by
Thomas Sabine
Purchase Details
Closed on
Oct 26, 1992
Bought by
Thomas Sabine
Purchase Details
Closed on
Jun 21, 1991
Bought by
Thomas Sabine
Purchase Details
Closed on
Apr 7, 1987
Bought by
Thomas Sabine
Purchase Details
Closed on
Apr 1, 1986
Bought by
Thomas Mark S
Create a Home Valuation Report for This Property
The Home Valuation Report is an in-depth analysis detailing your home's value as well as a comparison with similar homes in the area
Home Values in the Area
Average Home Value in this Area
Purchase History
| Date | Buyer | Sale Price | Title Company |
|---|---|---|---|
| Thomas Marksam Sabine | -- | None Available | |
| Nelson Sabine | -- | Unified Title Co Inc | |
| Nelson Bryan G | $99,700 | -- | |
| Thomas Sabine | $75,000 | -- | |
| Thomas Sabine | $47,500 | -- | |
| Thomas Sabine | -- | -- | |
| Thomas Sabine | -- | -- | |
| Thomas Mark S | -- | -- |
Source: Public Records
Mortgage History
| Date | Status | Borrower | Loan Amount |
|---|---|---|---|
| Previous Owner | Nelson Sabine | $94,300 | |
| Previous Owner | Nelson Bryan G | $101,490 | |
| Closed | Nelson Sabine | $8,000 |
Source: Public Records
Tax History Compared to Growth
Tax History
| Year | Tax Paid | Tax Assessment Tax Assessment Total Assessment is a certain percentage of the fair market value that is determined by local assessors to be the total taxable value of land and additions on the property. | Land | Improvement |
|---|---|---|---|---|
| 2025 | $1,725 | $24,750 | -- | -- |
| 2024 | $1,590 | $25,420 | $5,090 | $20,330 |
| 2023 | $1,590 | $25,420 | $5,090 | $20,330 |
| 2022 | $1,374 | $17,740 | $3,500 | $14,240 |
| 2021 | $1,480 | $18,250 | $3,600 | $14,650 |
| 2020 | $1,321 | $14,870 | $3,150 | $11,720 |
| 2019 | $1,315 | $14,870 | $3,150 | $11,720 |
| 2018 | $1,156 | $12,380 | $2,020 | $10,360 |
| 2017 | $1,167 | $12,380 | $2,020 | $10,360 |
| 2016 | $937 | $11,920 | $1,990 | $9,930 |
| 2015 | $958 | $11,920 | $1,990 | $9,930 |
| 2014 | $870 | $10,900 | $1,990 | $8,910 |
Source: Public Records
Map
Nearby Homes
- 4404 Bramble Ln
- 4421 Horizonpoint Dr
- 4332 Levi Ln
- 9208 Granger Ln
- 9328 Chieftan Dr
- 4386 Gunbarrel Dr
- 4380 Gunbarrel Dr
- 4512 Bramble Ln
- 4548 Bramble Ln
- 9558 Yukon Way
- Arcadia Plan at Meadoworks - Trinity Series
- Canyon Plan at Meadoworks - Yellowstone Series
- Enclave Plan at Meadoworks - Trinity Series
- Sancerre Plan at Meadoworks - Provence Series
- Creekside Plan at Meadoworks - Yellowstone Series
- Hayden Plan at Meadoworks - Yellowstone Series
- St Tropez Plan at Meadoworks - Provence Series
- Haven Plan at Meadoworks - Trinity Series
- Marseille Plan at Meadoworks - Provence Series
- Sunstone Plan at Meadoworks - Yellowstone Series
- 9124 Chieftan Dr
- 9132 Chieftan Dr
- 9120 Chieftan Dr
- 9116 Chieftan Dr
- 9138 Chieftan Dr
- 4304 Anvil Dr
- 9125 Chieftan Dr
- 4305 Anvil Dr
- 4305 Bramble Ln
- 9142 Chieftan Dr
- 9112 Chieftan Dr
- 4309 Anvil Dr
- 9146 Chieftan Dr
- 4304 Horizonpoint Dr
- 9108 Chieftan Dr
- 4313 Anvil Dr
- 4313 Bramble Ln
- 9204 Chieftan Dr
- 4308 Horizonpoint Dr
- 9104 Chieftan Dr