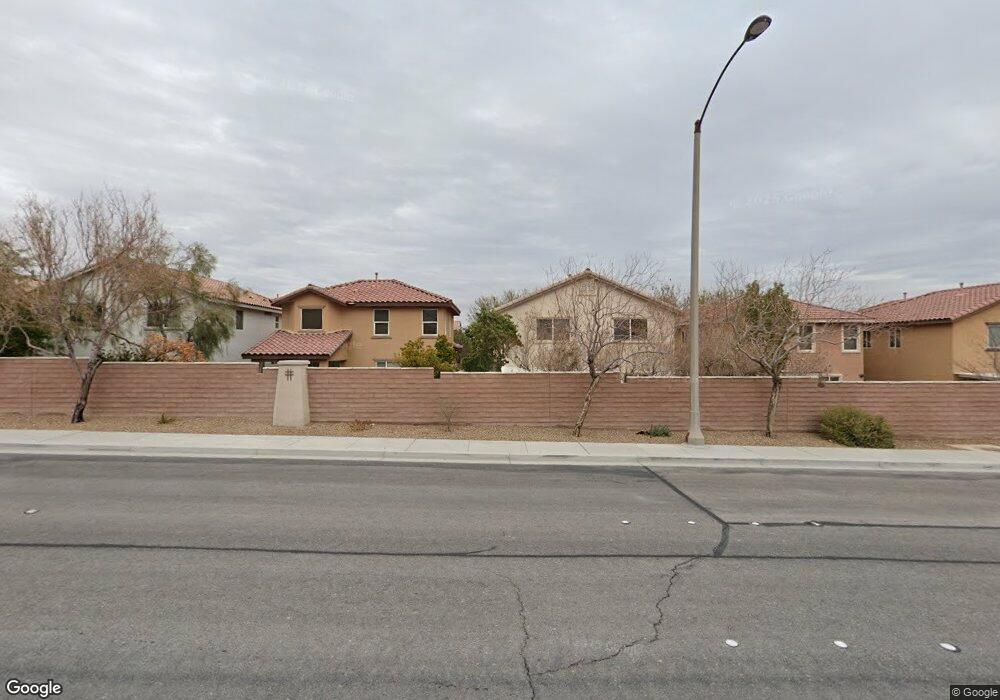
9128 Clear Sky Ave Las Vegas, NV 89178
Mountains Edge NeighborhoodEstimated Value: $442,236 - $475,000
3
Beds
3
Baths
1,995
Sq Ft
$232/Sq Ft
Est. Value
About This Home
This home is located at 9128 Clear Sky Ave, Las Vegas, NV 89178 and is currently estimated at $462,809, approximately $231 per square foot. 9128 Clear Sky Ave is a home located in Clark County with nearby schools including Sierra Vista High School, Doral Academy Cactus, and Good Samaritan Christian Academy.
Ownership History
Date
Name
Owned For
Owner Type
Purchase Details
Closed on
Jun 4, 2021
Sold by
Monconduit Zaida F
Bought by
Monconduit Zaida F and Ruiz Erica
Current Estimated Value
Purchase Details
Closed on
Jun 18, 2010
Sold by
Dugarte Vladimir
Bought by
Monconduit Zaida F
Home Financials for this Owner
Home Financials are based on the most recent Mortgage that was taken out on this home.
Original Mortgage
$137,600
Interest Rate
4.91%
Mortgage Type
New Conventional
Purchase Details
Closed on
Jul 31, 2006
Sold by
Meritage Homes Of Nevada Inc
Bought by
Dugarte Vladimir
Home Financials for this Owner
Home Financials are based on the most recent Mortgage that was taken out on this home.
Original Mortgage
$294,426
Interest Rate
6.75%
Mortgage Type
Unknown
Purchase Details
Closed on
Jan 9, 2006
Sold by
Acacia Credit Fund 8 & A Llc
Bought by
Mth Homes Nevada Inc
Create a Home Valuation Report for This Property
The Home Valuation Report is an in-depth analysis detailing your home's value as well as a comparison with similar homes in the area
Home Values in the Area
Average Home Value in this Area
Purchase History
| Date | Buyer | Sale Price | Title Company |
|---|---|---|---|
| Monconduit Zaida F | -- | None Listed On Document | |
| Monconduit Zaida F | $172,000 | Lawyers Title Of Nevada Vil | |
| Dugarte Vladimir | -- | Lawyers Title Of Nevada Vil | |
| Dugarte Vladimir | $368,033 | Chicago Title | |
| Mth Homes Nevada Inc | $3,437,426 | Chicago Title |
Source: Public Records
Mortgage History
| Date | Status | Borrower | Loan Amount |
|---|---|---|---|
| Previous Owner | Monconduit Zaida F | $137,600 | |
| Previous Owner | Dugarte Vladimir | $294,426 |
Source: Public Records
Tax History Compared to Growth
Tax History
| Year | Tax Paid | Tax Assessment Tax Assessment Total Assessment is a certain percentage of the fair market value that is determined by local assessors to be the total taxable value of land and additions on the property. | Land | Improvement |
|---|---|---|---|---|
| 2025 | $2,058 | $129,108 | $40,250 | $88,858 |
| 2024 | $1,992 | $129,108 | $40,250 | $88,858 |
| 2023 | $1,992 | $117,093 | $33,250 | $83,843 |
| 2022 | $1,934 | $106,151 | $29,750 | $76,401 |
| 2021 | $1,963 | $99,178 | $26,600 | $72,578 |
| 2020 | $1,820 | $98,403 | $26,600 | $71,803 |
| 2019 | $1,706 | $92,335 | $22,050 | $70,285 |
| 2018 | $1,628 | $85,629 | $18,200 | $67,429 |
| 2017 | $2,407 | $81,210 | $17,850 | $63,360 |
| 2016 | $1,599 | $70,284 | $12,250 | $58,034 |
| 2015 | $1,594 | $60,994 | $11,200 | $49,794 |
| 2014 | $1,476 | $47,987 | $6,300 | $41,687 |
Source: Public Records
Map
Nearby Homes
- 9161 Horizon Mist Ave
- 10473 Raining Sky St
- 9077 Creed Mountain Place
- 10373 Hawk Ravine St
- 10281 Wolves Den Ln
- 10560 S Dapple Gray Rd
- 10259 Wolves Den Ln
- 10260 Hawks Wing St
- 10300 S Dapple Gray Rd
- 9200 W Conn Ave
- 9092 National Park Dr
- 10330 Eve Springs St
- 10267 Running Falls St
- 10368 Saddle Mountain St
- 8754 Moon Crater Ave
- 9237 Weeping Water Ave
- 8768 Charm Canyon Ave
- 9338 Wilderness Glen Ave
- 9362 Wilderness Glen Ave
- 10320 Bluff Valley Ct Unit 2
- 9120 Clear Sky Ave
- 9136 Clear Sky Ave
- 9112 Clear Sky Ave
- 9129 Horizon Mist Ave
- 9121 Horizon Mist Ave
- 9137 Horizon Mist Ave
- 9104 Clear Sky Ave
- 9152 Clear Sky Ave
- 9113 Horizon Mist Ave
- 9145 Horizon Mist Ave
- 9127 Clear Sky Ave
- 9135 Clear Sky Ave
- 9119 Clear Sky Ave Unit 6
- 9105 Horizon Mist Ave
- 9153 Horizon Mist Ave
- 9143 Clear Sky Ave
- 9096 Clear Sky Ave
- 9096 Clear Sky Ave
- 9096 Clear Sky Ave
- 9160 Clear Sky Ave Unit 6