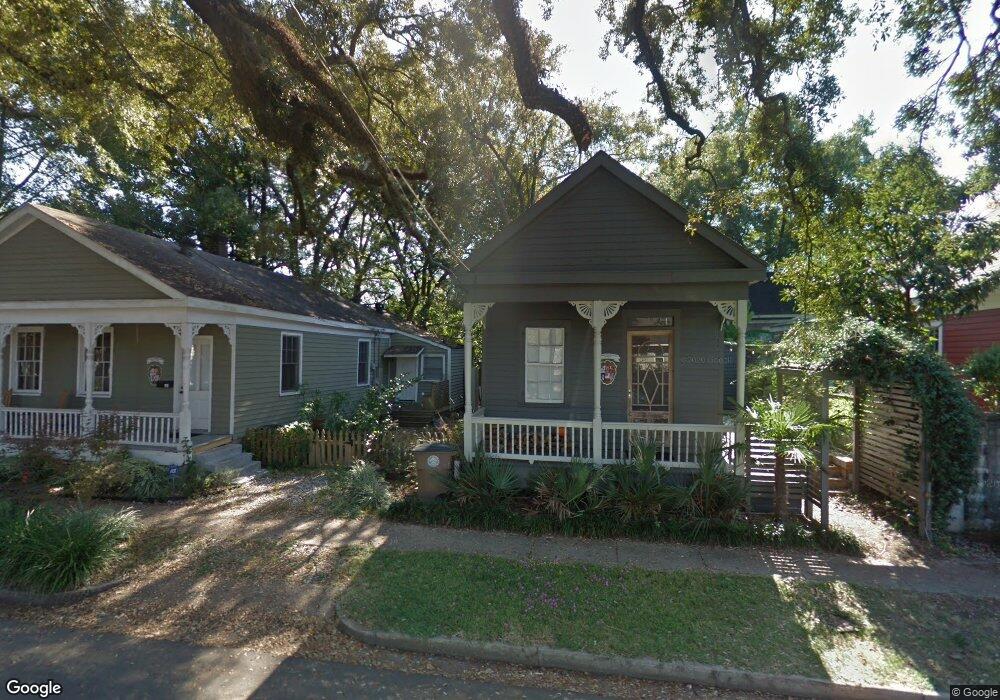
913 Augusta St Mobile, AL 36604
Washington Square NeighborhoodEstimated Value: $159,000 - $243,000
1
Bed
1
Bath
873
Sq Ft
$240/Sq Ft
Est. Value
About This Home
This home is located at 913 Augusta St, Mobile, AL 36604 and is currently estimated at $209,509, approximately $239 per square foot. 913 Augusta St is a home located in Mobile County with nearby schools including Leinkauf Elementary School, Calloway Smith Middle School, and Murphy High School.
Ownership History
Date
Name
Owned For
Owner Type
Purchase Details
Closed on
Oct 16, 2024
Sold by
Harvell Taylor
Bought by
Cashin Tyler and Cashin Katie R
Current Estimated Value
Home Financials for this Owner
Home Financials are based on the most recent Mortgage that was taken out on this home.
Original Mortgage
$187,220
Outstanding Balance
$184,695
Interest Rate
6.35%
Mortgage Type
FHA
Estimated Equity
$24,814
Purchase Details
Closed on
Nov 27, 2017
Sold by
Atchison Taylor
Bought by
Harvell Taylor
Home Financials for this Owner
Home Financials are based on the most recent Mortgage that was taken out on this home.
Original Mortgage
$129,456
Interest Rate
3.88%
Mortgage Type
Future Advance Clause Open End Mortgage
Purchase Details
Closed on
Nov 21, 2014
Sold by
Irvin Sarah E
Bought by
Atchison Taylor
Purchase Details
Closed on
Mar 20, 2001
Sold by
Bassett Denise M and Thames Gus B
Bought by
Irvine Sarah E
Create a Home Valuation Report for This Property
The Home Valuation Report is an in-depth analysis detailing your home's value as well as a comparison with similar homes in the area
Home Values in the Area
Average Home Value in this Area
Purchase History
| Date | Buyer | Sale Price | Title Company |
|---|---|---|---|
| Cashin Tyler | $230,000 | None Listed On Document | |
| Harvell Taylor | $144,000 | Associated Title Company | |
| Atchison Taylor | $37,500 | None Available | |
| Irvine Sarah E | $17,663 | -- |
Source: Public Records
Mortgage History
| Date | Status | Borrower | Loan Amount |
|---|---|---|---|
| Open | Cashin Tyler | $187,220 | |
| Previous Owner | Harvell Taylor | $129,456 |
Source: Public Records
Tax History
| Year | Tax Paid | Tax Assessment Tax Assessment Total Assessment is a certain percentage of the fair market value that is determined by local assessors to be the total taxable value of land and additions on the property. | Land | Improvement |
|---|---|---|---|---|
| 2025 | $648 | $11,350 | $1,360 | $9,990 |
| 2024 | $648 | $10,370 | $1,360 | $9,010 |
| 2023 | $602 | $10,150 | $1,360 | $8,790 |
| 2022 | $585 | $10,260 | $1,360 | $8,900 |
| 2021 | $592 | $10,370 | $1,360 | $9,010 |
| 2020 | $605 | $10,580 | $1,360 | $9,220 |
| 2019 | $635 | $11,060 | $0 | $0 |
| 2018 | $351 | $6,580 | $0 | $0 |
| 2017 | $351 | $6,580 | $0 | $0 |
| 2016 | $342 | $6,440 | $0 | $0 |
| 2013 | -- | $5,140 | $0 | $0 |
Source: Public Records
Map
Nearby Homes
- 352 Marine St
- 356 Marine St
- 306 Charles St
- 309 Chatham St
- 950 Elmira St
- 1053 Selma St
- 1205 Palmetto St
- 916 Church St Unit Lot 6
- 916 Church St Unit Lot 7
- 456 S Broad St
- 1052 Elmira St
- 101 Marine St
- 967 Texas St
- 1066 Church St
- 109 Marine St
- 105 Marine St
- 936 Government St
- 932 Government St
- 928 Government St
- 500 Charles St
Your Personal Tour Guide
Ask me questions while you tour the home.