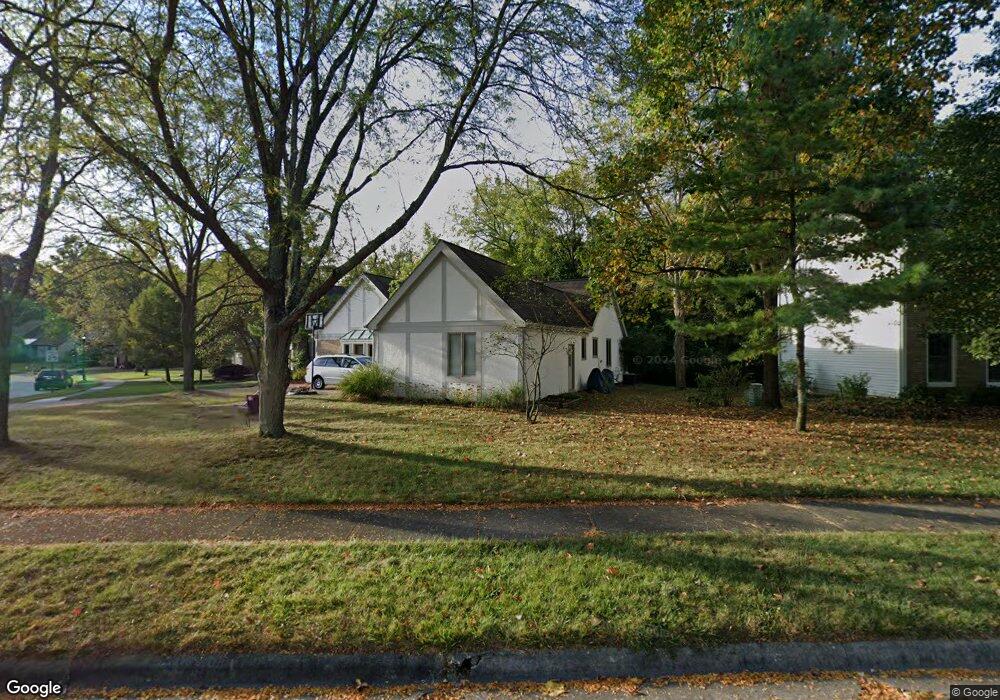
913 Babbington Ct Westerville, OH 43081
Estimated Value: $466,708 - $518,000
3
Beds
2
Baths
1,947
Sq Ft
$254/Sq Ft
Est. Value
About This Home
This home is located at 913 Babbington Ct, Westerville, OH 43081 and is currently estimated at $495,177, approximately $254 per square foot. 913 Babbington Ct is a home located in Franklin County with nearby schools including Mcvay Elementary School, Walnut Springs Middle School, and Westerville-North High School.
Ownership History
Date
Name
Owned For
Owner Type
Purchase Details
Closed on
Dec 17, 2020
Sold by
Drugan Steven M and Drugan Shenna B
Bought by
Cp And Ac Driscoll Trust and Driscoll
Current Estimated Value
Purchase Details
Closed on
Oct 12, 2012
Sold by
Stowe Karen S
Bought by
Drugan Steven M and Drugan Shenna B
Home Financials for this Owner
Home Financials are based on the most recent Mortgage that was taken out on this home.
Original Mortgage
$236,680
Interest Rate
3.57%
Mortgage Type
New Conventional
Purchase Details
Closed on
Mar 4, 1996
Sold by
Meacham Christopher D
Bought by
Karen S Stowe
Home Financials for this Owner
Home Financials are based on the most recent Mortgage that was taken out on this home.
Original Mortgage
$115,000
Interest Rate
7.07%
Mortgage Type
New Conventional
Purchase Details
Closed on
Jul 9, 1992
Purchase Details
Closed on
Jul 1, 1984
Create a Home Valuation Report for This Property
The Home Valuation Report is an in-depth analysis detailing your home's value as well as a comparison with similar homes in the area
Home Values in the Area
Average Home Value in this Area
Purchase History
| Date | Buyer | Sale Price | Title Company |
|---|---|---|---|
| Cp And Ac Driscoll Trust | $340,000 | Stewart Title | |
| Drugan Steven M | $244,000 | None Available | |
| Karen S Stowe | $180,000 | -- | |
| -- | $168,400 | -- | |
| -- | $129,800 | -- |
Source: Public Records
Mortgage History
| Date | Status | Borrower | Loan Amount |
|---|---|---|---|
| Previous Owner | Drugan Steven M | $236,680 | |
| Previous Owner | Karen S Stowe | $115,000 |
Source: Public Records
Tax History Compared to Growth
Tax History
| Year | Tax Paid | Tax Assessment Tax Assessment Total Assessment is a certain percentage of the fair market value that is determined by local assessors to be the total taxable value of land and additions on the property. | Land | Improvement |
|---|---|---|---|---|
| 2024 | $7,368 | $129,640 | $33,250 | $96,390 |
| 2023 | $7,211 | $129,640 | $33,250 | $96,390 |
| 2022 | $7,173 | $98,460 | $21,000 | $77,460 |
| 2021 | $7,234 | $98,460 | $21,000 | $77,460 |
| 2020 | $6,646 | $90,720 | $21,000 | $69,720 |
| 2019 | $5,853 | $75,430 | $17,500 | $57,930 |
| 2018 | $5,822 | $75,430 | $17,500 | $57,930 |
| 2017 | $5,757 | $75,430 | $17,500 | $57,930 |
| 2016 | $6,098 | $72,730 | $20,160 | $52,570 |
| 2015 | $5,906 | $72,730 | $20,160 | $52,570 |
| 2014 | $5,910 | $72,730 | $20,160 | $52,570 |
| 2013 | $2,811 | $69,265 | $19,215 | $50,050 |
Source: Public Records
Map
Nearby Homes
- 969 Farrington Dr
- 613 Valley Wood Ct
- 371 Delaware Dr
- 461 Delaware Ct
- 994 Autumn Lake Ct
- 1146 Forest Rise Dr
- 192 Buckeye Ct
- 1368 Nutmeg Ct
- 182 Hillcrest Dr
- 750 Autumn Branch Rd
- 737 Autumn Branch Rd
- 90 Spring Creek Dr
- 1209 Chatham Ridge Rd
- 768 Collingwood Dr
- 1201 Wallean Dr
- 800 S Spring Rd
- 1260 Autumn Park Ct
- 0 Cherrington Rd Unit 225023909
- 640 Brook Run Dr
- 810 Applewood Ln
- 905 Babbington Ct
- 387 Mainsail Dr
- 897 Babbington Ct
- 382 Mainsail Dr
- 910 Babbington Ct
- 395 Mainsail Dr
- 902 Babbington Ct
- 392 Mainsail Dr
- 889 Babbington Ct
- 930 Charterhouse Ct
- 403 Mainsail Dr
- 886 Babbington Ct
- 943 Charterhouse Ct
- 408 Mainsail Dr
- 436 Liberty Ln
- 347 Mainsail Dr
- 428 Liberty Ln
- 881 Babbington Ct
- 346 Mainsail Dr
- 420 Liberty Ln