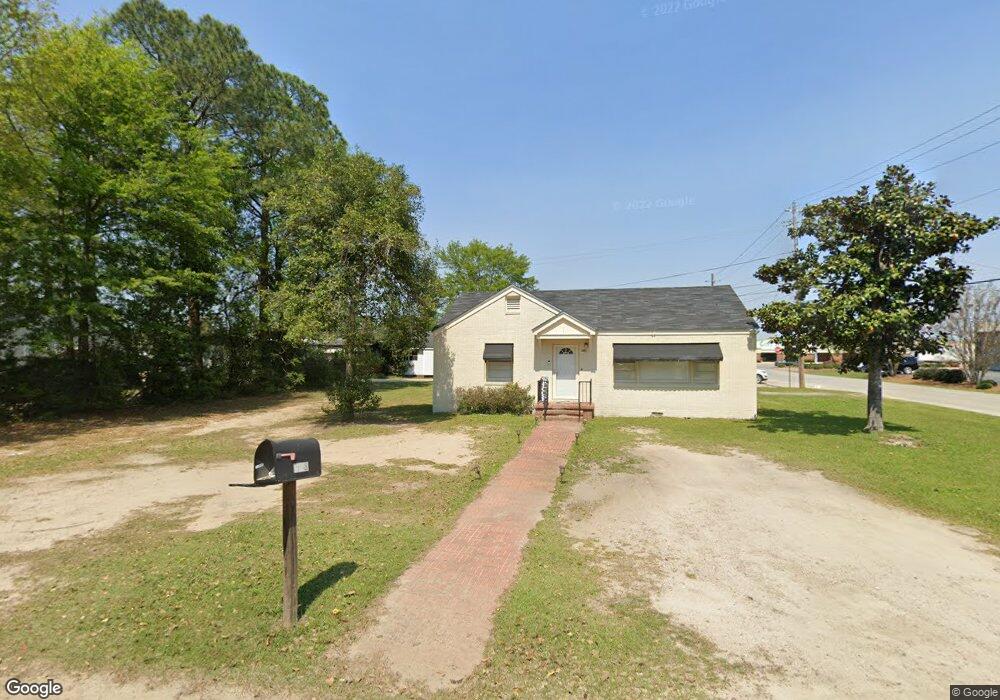
913 E 17th Ave Cordele, GA 31015
Estimated Value: $66,000 - $78,000
2
Beds
2
Baths
1,092
Sq Ft
$67/Sq Ft
Est. Value
About This Home
This home is located at 913 E 17th Ave, Cordele, GA 31015 and is currently estimated at $73,552, approximately $67 per square foot. 913 E 17th Ave is a home located in Crisp County with nearby schools including Crisp County Elementary School, Crisp County Primary School, and Crisp County Middle School.
Ownership History
Date
Name
Owned For
Owner Type
Purchase Details
Closed on
Jul 14, 2023
Sold by
White Jane
Bought by
Southern Investment Properties Llc
Current Estimated Value
Purchase Details
Closed on
Sep 2, 2008
Sold by
Crenshaw Joe H
Bought by
White Jane and White James Michael
Purchase Details
Closed on
Aug 13, 2008
Sold by
Crenshaw Perry D
Bought by
Crenshaw Joe H
Purchase Details
Closed on
Feb 12, 2008
Sold by
Mobile Brokers Llc
Bought by
Crenshaw Joe H and Crenshaw Perry D
Purchase Details
Closed on
Nov 27, 2006
Sold by
Three Sisters Properties Llc
Bought by
Mobile Brokers Llc
Purchase Details
Closed on
Oct 2, 1997
Sold by
Lindeman Joel G
Bought by
Ybbot Inc
Purchase Details
Closed on
Oct 13, 1995
Sold by
Lindeman Myrtle
Bought by
Lindeman Joel G
Purchase Details
Closed on
Dec 11, 1992
Sold by
Lindeman Myrtle
Bought by
Lindeman Myrtle
Purchase Details
Closed on
Oct 11, 1965
Bought by
Lindeman Myrtle
Create a Home Valuation Report for This Property
The Home Valuation Report is an in-depth analysis detailing your home's value as well as a comparison with similar homes in the area
Purchase History
| Date | Buyer | Sale Price | Title Company |
|---|---|---|---|
| Southern Investment Properties Llc | -- | -- | |
| White Jane | $82,000 | -- | |
| Crenshaw Joe H | -- | -- | |
| Crenshaw Joe H | $71,000 | -- | |
| Mobile Brokers Llc | $56,000 | -- | |
| Ybbot Inc | $50,000 | -- | |
| Lindeman Joel G | -- | -- | |
| Lindeman Myrtle | -- | -- | |
| Lindeman Myrtle | -- | -- |
Source: Public Records
Tax History Compared to Growth
Tax History
| Year | Tax Paid | Tax Assessment Tax Assessment Total Assessment is a certain percentage of the fair market value that is determined by local assessors to be the total taxable value of land and additions on the property. | Land | Improvement |
|---|---|---|---|---|
| 2025 | $827 | $23,446 | $2,971 | $20,475 |
| 2024 | $765 | $21,347 | $2,971 | $18,376 |
| 2023 | $705 | $18,813 | $1,486 | $17,327 |
| 2022 | $470 | $17,764 | $1,486 | $16,278 |
| 2021 | $460 | $16,714 | $1,486 | $15,228 |
| 2020 | $470 | $16,714 | $1,486 | $15,228 |
| 2019 | $474 | $16,714 | $1,486 | $15,228 |
| 2018 | $409 | $13,872 | $2,822 | $11,050 |
| 2017 | $563 | $13,872 | $2,822 | $11,050 |
| 2016 | $410 | $13,872 | $2,822 | $11,050 |
| 2015 | -- | $13,873 | $2,822 | $11,050 |
| 2014 | -- | $13,873 | $2,822 | $11,050 |
| 2013 | -- | $13,872 | $2,822 | $11,050 |
Source: Public Records
Map
Nearby Homes