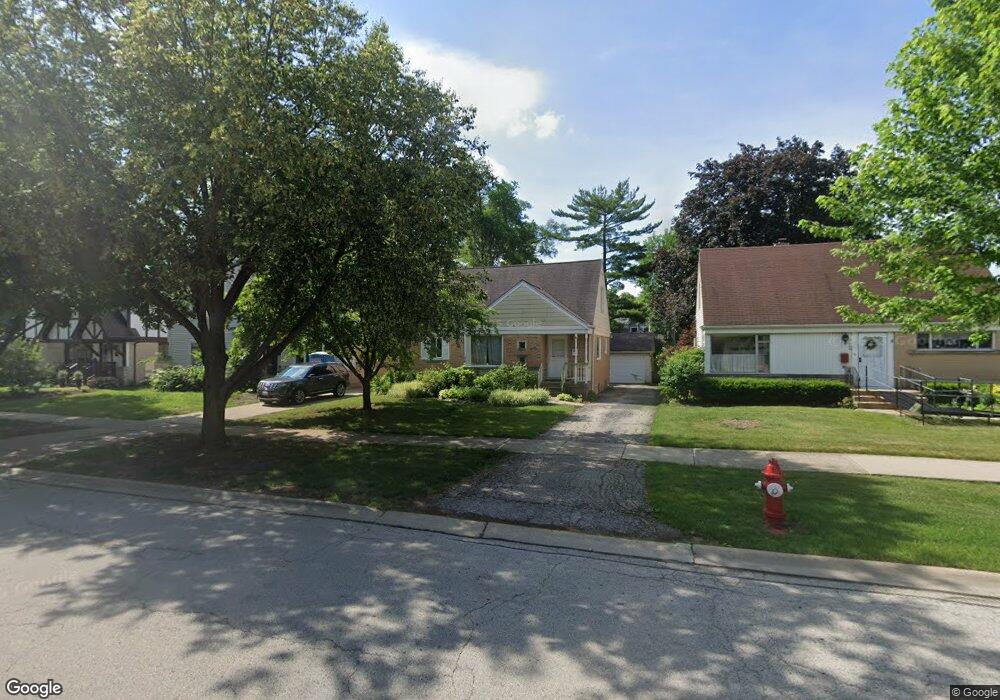
913 E Olive St Arlington Heights, IL 60004
Estimated Value: $411,000 - $549,000
3
Beds
2
Baths
1,451
Sq Ft
$328/Sq Ft
Est. Value
About This Home
This home is located at 913 E Olive St, Arlington Heights, IL 60004 and is currently estimated at $475,880, approximately $327 per square foot. 913 E Olive St is a home located in Cook County with nearby schools including Olive-Mary Stitt Elementary School, Thomas Middle School, and John Hersey High School.
Ownership History
Date
Name
Owned For
Owner Type
Purchase Details
Closed on
Jun 28, 2010
Sold by
Bartlett Robert
Bought by
Bartlett Leanne
Current Estimated Value
Purchase Details
Closed on
Mar 26, 1998
Sold by
Gorman Lorraine Dent
Bought by
Bartlett Robert E and Bartlett Leanne
Home Financials for this Owner
Home Financials are based on the most recent Mortgage that was taken out on this home.
Original Mortgage
$153,000
Outstanding Balance
$25,976
Interest Rate
7.27%
Estimated Equity
$449,904
Create a Home Valuation Report for This Property
The Home Valuation Report is an in-depth analysis detailing your home's value as well as a comparison with similar homes in the area
Purchase History
| Date | Buyer | Sale Price | Title Company |
|---|---|---|---|
| Bartlett Leanne | -- | None Available | |
| Bartlett Robert E | $170,000 | -- |
Source: Public Records
Mortgage History
| Date | Status | Borrower | Loan Amount |
|---|---|---|---|
| Open | Bartlett Robert E | $153,000 |
Source: Public Records
Tax History
| Year | Tax Paid | Tax Assessment Tax Assessment Total Assessment is a certain percentage of the fair market value that is determined by local assessors to be the total taxable value of land and additions on the property. | Land | Improvement |
|---|---|---|---|---|
| 2025 | $9,221 | $38,000 | $8,400 | $29,600 |
| 2024 | $9,221 | $37,000 | $7,000 | $30,000 |
| 2023 | $8,854 | $37,000 | $7,000 | $30,000 |
| 2022 | $8,854 | $37,000 | $7,000 | $30,000 |
| 2021 | $6,866 | $26,138 | $4,375 | $21,763 |
| 2020 | $6,755 | $26,138 | $4,375 | $21,763 |
| 2019 | $6,725 | $29,043 | $4,375 | $24,668 |
| 2018 | $5,837 | $23,437 | $3,850 | $19,587 |
| 2017 | $5,786 | $23,437 | $3,850 | $19,587 |
| 2016 | $5,632 | $23,437 | $3,850 | $19,587 |
| 2015 | $5,235 | $20,352 | $3,325 | $17,027 |
| 2014 | $5,098 | $20,352 | $3,325 | $17,027 |
| 2013 | $4,952 | $20,352 | $3,325 | $17,027 |
Source: Public Records
Map
Nearby Homes
- 1320 N Douglas Ave
- 1120 N Haddow Ave
- 1554 N Windsor Dr
- 1130 N Stratford Rd
- 1612 N Windsor Dr
- 1501 N Courtland Dr Unit 311501
- 1670 N Douglas Ct Unit 86
- 730 N Wilshire Ln
- 634 N Dryden Ave
- 1748 N Windsor Dr
- 1007 E Palatine Rd
- 703 N Gibbons Ave
- 300 E Euclid Ave
- 415 N Haddow Ave
- 1142 N Mitchell Ave
- 1804 E Euclid Ave
- 2019 E Avon Ln
- 2002 N Eastwood Dr
- 1222 N Walnut Ave
- 2013 N Windsor Dr
- 917 E Olive St
- 909 E Olive St
- 905 E Olive St
- 921 E Olive St
- 1180 N Beverly Ln
- 1176 N Beverly Ln
- 1184 N Beverly Ln
- 901 E Olive St
- 1174 N Beverly Ln
- 1188 N Beverly Ln
- 1256 N Dryden Place
- 819 E Olive St
- 1172 N Beverly Ln
- 918 E Olive St
- 912 E Olive St
- 1244 N Dryden Place
- 1304 N Dryden Ave
- 908 E Olive St
- 902 E Olive St
- 1225 N Dryden Ave
Your Personal Tour Guide
Ask me questions while you tour the home.