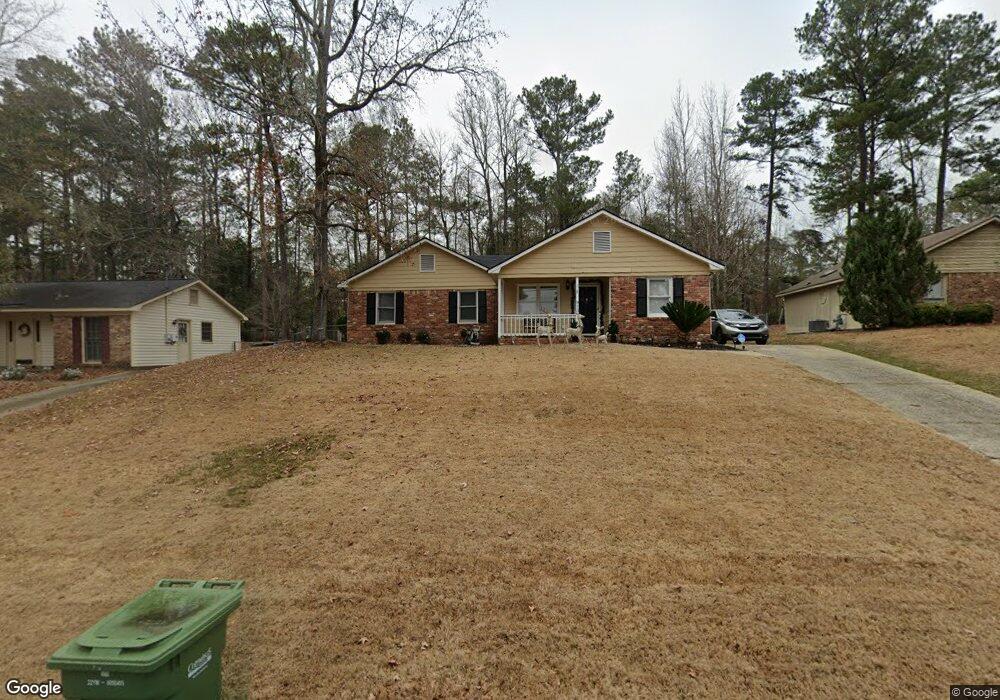
913 Eden St Columbus, GA 31904
Northern Columbus NeighborhoodEstimated Value: $197,000 - $219,000
3
Beds
3
Baths
1,380
Sq Ft
$150/Sq Ft
Est. Value
About This Home
This home is located at 913 Eden St, Columbus, GA 31904 and is currently estimated at $207,152, approximately $150 per square foot. 913 Eden St is a home located in Muscogee County with nearby schools including Double Churches Elementary School, Veterans Memorial Middle School, and Northside High School.
Ownership History
Date
Name
Owned For
Owner Type
Purchase Details
Closed on
Oct 30, 2017
Sold by
Young Diana Gherdhi
Bought by
Duckworth Rodney T and Duckworth Stephanie L
Current Estimated Value
Home Financials for this Owner
Home Financials are based on the most recent Mortgage that was taken out on this home.
Original Mortgage
$131,671
Outstanding Balance
$110,276
Interest Rate
3.83%
Mortgage Type
VA
Estimated Equity
$96,876
Purchase Details
Closed on
Apr 17, 2014
Sold by
Kennon Realty Svcs Inc
Bought by
Gherghi Diana
Home Financials for this Owner
Home Financials are based on the most recent Mortgage that was taken out on this home.
Original Mortgage
$98,400
Interest Rate
4.37%
Mortgage Type
New Conventional
Purchase Details
Closed on
Aug 6, 2013
Sold by
Reynolds Debra A
Bought by
Kennon Realty Svcs Inc
Create a Home Valuation Report for This Property
The Home Valuation Report is an in-depth analysis detailing your home's value as well as a comparison with similar homes in the area
Home Values in the Area
Average Home Value in this Area
Purchase History
| Date | Buyer | Sale Price | Title Company |
|---|---|---|---|
| Duckworth Rodney T | $128,900 | -- | |
| Gherghi Diana | $123,000 | -- | |
| Kennon Realty Svcs Inc | $74,105 | -- |
Source: Public Records
Mortgage History
| Date | Status | Borrower | Loan Amount |
|---|---|---|---|
| Open | Duckworth Rodney T | $131,671 | |
| Previous Owner | Gherghi Diana | $98,400 |
Source: Public Records
Tax History Compared to Growth
Tax History
| Year | Tax Paid | Tax Assessment Tax Assessment Total Assessment is a certain percentage of the fair market value that is determined by local assessors to be the total taxable value of land and additions on the property. | Land | Improvement |
|---|---|---|---|---|
| 2025 | $1,235 | $58,304 | $8,308 | $49,996 |
| 2024 | $1,235 | $58,304 | $8,308 | $49,996 |
| 2023 | $549 | $58,304 | $8,308 | $49,996 |
| 2022 | $1,288 | $47,568 | $8,308 | $39,260 |
| 2021 | $1,281 | $48,740 | $8,308 | $40,432 |
| 2020 | $1,282 | $44,768 | $8,308 | $36,460 |
| 2019 | $1,287 | $44,768 | $8,308 | $36,460 |
| 2018 | $1,287 | $44,768 | $8,308 | $36,460 |
| 2017 | $1,840 | $44,768 | $8,308 | $36,460 |
| 2016 | $2,030 | $49,200 | $5,550 | $43,650 |
| 2015 | $2,032 | $49,200 | $5,550 | $43,650 |
| 2014 | $1,408 | $34,054 | $5,550 | $28,504 |
| 2013 | -- | $34,054 | $5,550 | $28,504 |
Source: Public Records
Map
Nearby Homes
- 8259 Lantern Ln
- 928 Heiferhorn Trace
- 8344 Twin Chapel Dr
- 7841 Edgewater Dr
- 1058 Cedarbrook Dr
- 7635 Edgewater Dr
- 7701 Gray Shoals Dr
- 1579 Magnolia Way
- 517 Double Churches Rd
- 155 Hydrangea Rd
- 281 Zachary Ct
- 706 Moore Rd
- 609 Moore Rd
- 1535 Doubletree Dr
- 907 Double Churches Rd
- 8935 A N Moore Rd
- 5080 Hawks Ridge Dr
- 7718 River Crest Dr
- 1727 Fountain Ct
- 7348 Cedar Creek Loop