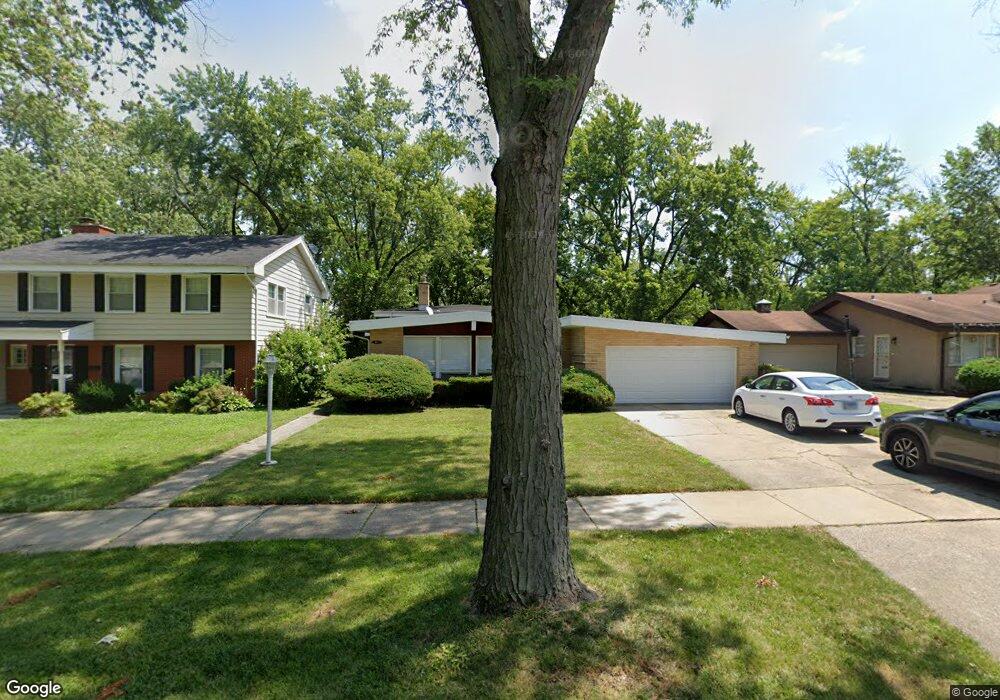
913 Elm St Flossmoor, IL 60422
Estimated Value: $244,000 - $275,000
3
Beds
2
Baths
1,561
Sq Ft
$166/Sq Ft
Est. Value
About This Home
This home is located at 913 Elm St, Flossmoor, IL 60422 and is currently estimated at $259,518, approximately $166 per square foot. 913 Elm St is a home located in Cook County with nearby schools including Flossmoor Hills Elementary School, Parker Junior High School, and Homewood-Flossmoor High School.
Ownership History
Date
Name
Owned For
Owner Type
Purchase Details
Closed on
Jan 24, 2005
Sold by
Stampley Vienea
Bought by
Martin Craig E
Current Estimated Value
Home Financials for this Owner
Home Financials are based on the most recent Mortgage that was taken out on this home.
Original Mortgage
$169,653
Outstanding Balance
$79,654
Interest Rate
5%
Mortgage Type
Unknown
Estimated Equity
$179,864
Purchase Details
Closed on
May 25, 2000
Sold by
Stampley Eugene
Bought by
Stampley Vienea
Purchase Details
Closed on
Sep 24, 1993
Sold by
Weiss Herbert H and Weiss Helene L
Bought by
Stampley Eugene and Stampley Vienea
Home Financials for this Owner
Home Financials are based on the most recent Mortgage that was taken out on this home.
Original Mortgage
$87,900
Interest Rate
7.15%
Create a Home Valuation Report for This Property
The Home Valuation Report is an in-depth analysis detailing your home's value as well as a comparison with similar homes in the area
Home Values in the Area
Average Home Value in this Area
Purchase History
| Date | Buyer | Sale Price | Title Company |
|---|---|---|---|
| Martin Craig E | $175,000 | -- | |
| Stampley Vienea | -- | -- | |
| Stampley Eugene | $98,666 | -- |
Source: Public Records
Mortgage History
| Date | Status | Borrower | Loan Amount |
|---|---|---|---|
| Open | Martin Craig E | $169,653 | |
| Previous Owner | Stampley Eugene | $87,900 |
Source: Public Records
Tax History
| Year | Tax Paid | Tax Assessment Tax Assessment Total Assessment is a certain percentage of the fair market value that is determined by local assessors to be the total taxable value of land and additions on the property. | Land | Improvement |
|---|---|---|---|---|
| 2025 | $8,379 | $23,000 | $3,548 | $19,452 |
| 2024 | $8,379 | $23,000 | $3,548 | $19,452 |
| 2023 | $6,772 | $23,000 | $3,548 | $19,452 |
| 2022 | $6,772 | $16,013 | $3,131 | $12,882 |
| 2021 | $6,833 | $16,011 | $3,130 | $12,881 |
| 2020 | $6,663 | $16,011 | $3,130 | $12,881 |
| 2019 | $6,400 | $15,305 | $2,922 | $12,383 |
| 2018 | $6,156 | $15,305 | $2,922 | $12,383 |
| 2017 | $6,075 | $15,305 | $2,922 | $12,383 |
| 2016 | $5,886 | $13,610 | $2,713 | $10,897 |
| 2015 | $5,847 | $13,610 | $2,713 | $10,897 |
| 2014 | $5,765 | $13,610 | $2,713 | $10,897 |
| 2013 | $6,024 | $15,238 | $2,713 | $12,525 |
Source: Public Records
Map
Nearby Homes
- 835 Maple Rd
- 3712 Beech St
- 3641 Beech St
- 3746 Cherry Hills Dr
- 754 Central Park Ave
- 1034 Central Park Ave
- 3533 Flossmoor Rd
- 19002 Springfield Ave
- 3710 Briar Ln
- 18840 Harding Ave
- 3800 River Rd
- 18900 Oakwood Ct
- 4036 W 187th St
- 18941 Cypress Ave Unit 2
- 3902 Edgewater Dr
- 18600 Village West Dr Unit 310
- 18600 Village West Dr Unit 303
- 19020 Kedzie Ave
- 4445 Provincetown Dr
- 4008 192nd Place
Your Personal Tour Guide
Ask me questions while you tour the home.