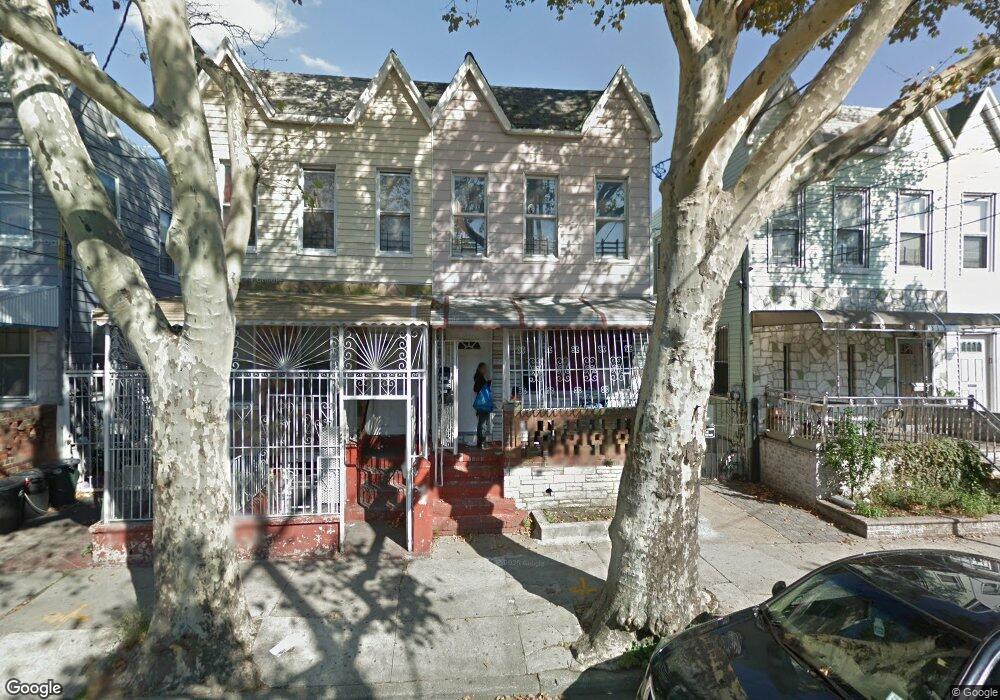
913 Elton St Brooklyn, NY 11208
East New York NeighborhoodEstimated Value: $603,020 - $930,000
6
Beds
3
Baths
1,472
Sq Ft
$544/Sq Ft
Est. Value
About This Home
This home is located at 913 Elton St, Brooklyn, NY 11208 and is currently estimated at $801,255, approximately $544 per square foot. 913 Elton St is a home located in Kings County with nearby schools including P.S. 273 Wortman, Van Siclen Community Middle School, and Imagine Me Leadership Charter School.
Ownership History
Date
Name
Owned For
Owner Type
Purchase Details
Closed on
Jul 11, 2006
Sold by
Herrera Dora and Herrera Valeriano
Bought by
Herrera Valeriano
Current Estimated Value
Purchase Details
Closed on
Jul 28, 2004
Sold by
A1 Holding Corp
Bought by
Herrera Dora and Herrera Valeriano
Home Financials for this Owner
Home Financials are based on the most recent Mortgage that was taken out on this home.
Original Mortgage
$356,412
Interest Rate
6.16%
Mortgage Type
Purchase Money Mortgage
Purchase Details
Closed on
Mar 15, 2004
Sold by
Burgos Fernando
Bought by
A-1 Holding Corp
Purchase Details
Closed on
Dec 29, 2000
Sold by
Asencio Pablo
Bought by
Burgos Fernando
Home Financials for this Owner
Home Financials are based on the most recent Mortgage that was taken out on this home.
Original Mortgage
$199,898
Interest Rate
7.14%
Mortgage Type
FHA
Create a Home Valuation Report for This Property
The Home Valuation Report is an in-depth analysis detailing your home's value as well as a comparison with similar homes in the area
Home Values in the Area
Average Home Value in this Area
Purchase History
| Date | Buyer | Sale Price | Title Company |
|---|---|---|---|
| Herrera Valeriano | -- | -- | |
| Herrera Valeriano | -- | -- | |
| Herrera Dora | $361,000 | -- | |
| Herrera Dora | $361,000 | -- | |
| A-1 Holding Corp | $245,000 | -- | |
| A-1 Holding Corp | $245,000 | -- | |
| Burgos Fernando | $200,000 | Stewart Title Insurance Co | |
| Burgos Fernando | $200,000 | Stewart Title Insurance Co |
Source: Public Records
Mortgage History
| Date | Status | Borrower | Loan Amount |
|---|---|---|---|
| Previous Owner | Herrera Dora | $356,412 | |
| Previous Owner | Burgos Fernando | $199,898 | |
| Closed | Herrera Valeriano | $0 |
Source: Public Records
Tax History Compared to Growth
Tax History
| Year | Tax Paid | Tax Assessment Tax Assessment Total Assessment is a certain percentage of the fair market value that is determined by local assessors to be the total taxable value of land and additions on the property. | Land | Improvement |
|---|---|---|---|---|
| 2025 | $5,081 | $39,420 | $10,140 | $29,280 |
| 2024 | $5,081 | $39,660 | $10,140 | $29,520 |
| 2023 | $4,962 | $41,460 | $10,140 | $31,320 |
| 2022 | $4,613 | $42,660 | $10,140 | $32,520 |
| 2021 | $4,599 | $36,660 | $10,140 | $26,520 |
| 2020 | $2,286 | $41,880 | $10,140 | $31,740 |
| 2019 | $4,410 | $37,140 | $10,140 | $27,000 |
| 2018 | $4,151 | $20,361 | $5,294 | $15,067 |
| 2017 | $3,926 | $19,257 | $7,675 | $11,582 |
| 2016 | $3,641 | $18,212 | $6,809 | $11,403 |
| 2015 | $2,191 | $18,212 | $7,035 | $11,177 |
| 2014 | $2,191 | $17,569 | $6,677 | $10,892 |
Source: Public Records
Map
Nearby Homes
- 846 Stanley Ave
- 819 Ashford St
- 12427 Flatlands Ave Unit 1A
- 12399 Flatlands Ave Unit 9L
- 12421 Flatlands Ave Unit 1F
- 12399 Flatlands Ave Unit 1L
- 12399 Flatlands Ave
- 400 Cozine Ave Unit 9G
- 12399 Flatlands Ave Unit 3A
- 12441 Flatlands Ave Unit BA
- 2195 Linden Blvd
- 328 Wortman Ave
- 328 Wortman Ave Unit HSE
- 942 Jerome St
- 971 Jerome St Unit 4L
- 971 Jerome St Unit 5J
- 956 Hegeman Ave
- 980 Jerome St
- 586 Milford St
- 971 Schenck Ave
- 915 Elton St
- 911 Elton St
- 917 Elton St
- 909 Elton St
- 909 Elton St Unit GARDEN
- 909 Elton St Unit 1
- 919 Elton St
- 919 Elton St Unit 2
- 907 Elton St
- 921 Elton St
- 905 Elton St
- 923 Elton St
- 1001-1004 Linwood St
- 1006 Linwood St
- 457-463 Wortman Ave
- 916 Elton St
- 920 Elton St
- 912 Elton St
- 924 Elton St
- 908 Elton St