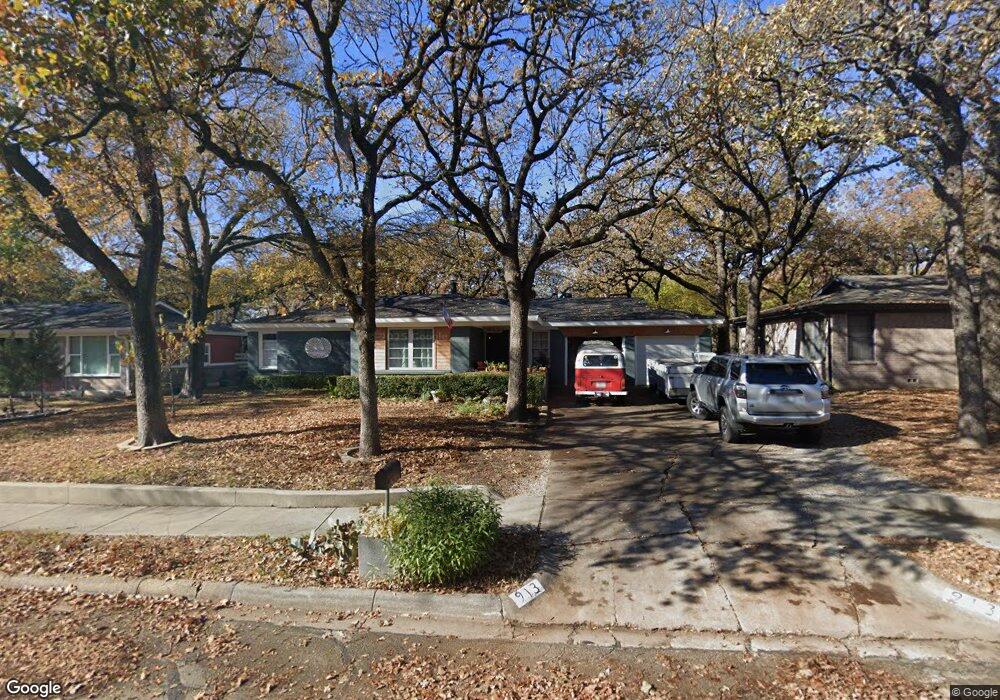
913 Glenda Dr Bedford, TX 76022
Estimated Value: $260,000 - $285,000
3
Beds
2
Baths
1,372
Sq Ft
$199/Sq Ft
Est. Value
About This Home
This home is located at 913 Glenda Dr, Bedford, TX 76022 and is currently estimated at $272,396, approximately $198 per square foot. 913 Glenda Dr is a home located in Tarrant County with nearby schools including Stonegate Elementary School, Central J High School, and L.D. Bell High School.
Ownership History
Date
Name
Owned For
Owner Type
Purchase Details
Closed on
Aug 22, 2008
Sold by
Deutsche Bank National Trust Co
Bought by
Harlan John
Current Estimated Value
Home Financials for this Owner
Home Financials are based on the most recent Mortgage that was taken out on this home.
Original Mortgage
$71,250
Outstanding Balance
$46,671
Interest Rate
6.29%
Mortgage Type
Purchase Money Mortgage
Estimated Equity
$225,725
Purchase Details
Closed on
Sep 25, 2006
Sold by
Kirk Marrissa and Kirk Tyrone
Bought by
Deutsche Bank National Trust Co and Mlmi Trust Series 2007-Mln1
Home Financials for this Owner
Home Financials are based on the most recent Mortgage that was taken out on this home.
Original Mortgage
$106,000
Interest Rate
10.77%
Mortgage Type
Balloon
Create a Home Valuation Report for This Property
The Home Valuation Report is an in-depth analysis detailing your home's value as well as a comparison with similar homes in the area
Home Values in the Area
Average Home Value in this Area
Purchase History
| Date | Buyer | Sale Price | Title Company |
|---|---|---|---|
| Harlan John | -- | Lsi Title Agency | |
| Deutsche Bank National Trust Co | $60,377 | None Available | |
| Kirk Tyrone | -- | None Available |
Source: Public Records
Mortgage History
| Date | Status | Borrower | Loan Amount |
|---|---|---|---|
| Open | Harlan John | $71,250 | |
| Previous Owner | Kirk Tyrone | $106,000 |
Source: Public Records
Tax History Compared to Growth
Tax History
| Year | Tax Paid | Tax Assessment Tax Assessment Total Assessment is a certain percentage of the fair market value that is determined by local assessors to be the total taxable value of land and additions on the property. | Land | Improvement |
|---|---|---|---|---|
| 2025 | $3,203 | $248,673 | $55,000 | $193,673 |
| 2024 | $3,203 | $248,673 | $55,000 | $193,673 |
| 2023 | $2,881 | $229,823 | $35,000 | $194,823 |
| 2022 | $4,073 | $198,194 | $35,000 | $163,194 |
| 2021 | $3,993 | $192,543 | $35,000 | $157,543 |
| 2020 | $3,664 | $154,099 | $35,000 | $119,099 |
| 2019 | $3,851 | $158,518 | $35,000 | $123,518 |
| 2018 | $3,292 | $135,505 | $16,000 | $119,505 |
| 2017 | $3,273 | $135,315 | $16,000 | $119,315 |
| 2016 | $2,680 | $110,799 | $16,000 | $94,799 |
| 2015 | $2,338 | $93,100 | $15,000 | $78,100 |
| 2014 | $2,338 | $93,100 | $15,000 | $78,100 |
Source: Public Records
Map
Nearby Homes
- 905 Brown Trail
- 341 Hurst Dr
- 344 Bedford Ct E
- 803 Glenda Dr
- 802 Brown Trail
- 849 Russell Ln
- 1008 Russell Ln
- 1136 Simpson Dr
- 501 Merrill Dr
- 1220 Norwood Dr
- 1236 King Dr
- 933 Wade Dr
- 1016 Keith Dr
- 1108 Wade Dr
- 127 W Cedar St
- 116 Oakhurst Dr
- 604 Donna Ln
- 49 Coffee Tavern Rd
- 832 Chateau Valee Cir
- 644 Caduceus Ln