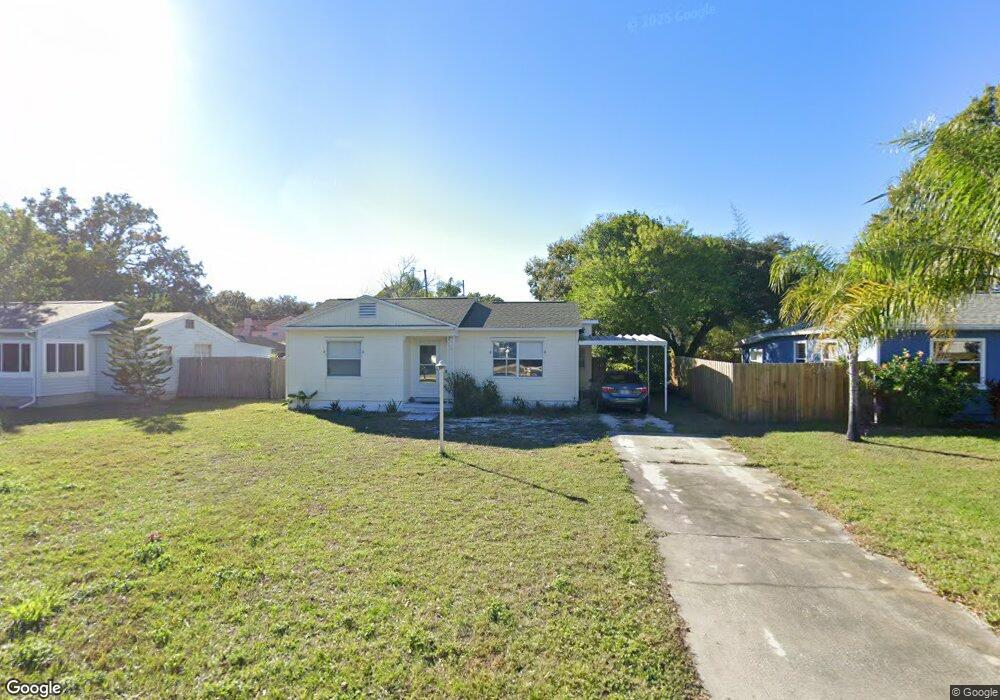
913 Gray St S Gulfport, FL 33707
Estimated Value: $336,000 - $409,000
3
Beds
2
Baths
1,284
Sq Ft
$287/Sq Ft
Est. Value
About This Home
This home is located at 913 Gray St S, Gulfport, FL 33707 and is currently estimated at $368,073, approximately $286 per square foot. 913 Gray St S is a home located in Pinellas County with nearby schools including Bear Creek Elementary School, Azalea Middle School, and Boca Ciega High School.
Ownership History
Date
Name
Owned For
Owner Type
Purchase Details
Closed on
Apr 16, 2010
Sold by
Rent To Own Leasing Co Inc and King Stephen B
Bought by
Brock Lorna A
Current Estimated Value
Home Financials for this Owner
Home Financials are based on the most recent Mortgage that was taken out on this home.
Original Mortgage
$103,100
Outstanding Balance
$69,915
Interest Rate
5.37%
Mortgage Type
FHA
Estimated Equity
$298,158
Purchase Details
Closed on
Sep 22, 2009
Sold by
Vadehra Melody
Bought by
Rent To Own Leasing Co Inc and King Stephen B
Purchase Details
Closed on
Jun 23, 2006
Sold by
Smith Thomas A and Smith Janet R
Bought by
Vadehra Melody
Home Financials for this Owner
Home Financials are based on the most recent Mortgage that was taken out on this home.
Original Mortgage
$43,000
Interest Rate
6.57%
Mortgage Type
Stand Alone Second
Create a Home Valuation Report for This Property
The Home Valuation Report is an in-depth analysis detailing your home's value as well as a comparison with similar homes in the area
Home Values in the Area
Average Home Value in this Area
Purchase History
| Date | Buyer | Sale Price | Title Company |
|---|---|---|---|
| Brock Lorna A | $105,000 | A Heritage Title Pinellas In | |
| Rent To Own Leasing Co Inc | $62,500 | None Available | |
| Vadehra Melody | $215,000 | Stewart Title Of Pinellas |
Source: Public Records
Mortgage History
| Date | Status | Borrower | Loan Amount |
|---|---|---|---|
| Open | Brock Lorna A | $103,100 | |
| Previous Owner | Vadehra Melody | $43,000 | |
| Previous Owner | Vadehra Melody | $172,000 |
Source: Public Records
Tax History Compared to Growth
Tax History
| Year | Tax Paid | Tax Assessment Tax Assessment Total Assessment is a certain percentage of the fair market value that is determined by local assessors to be the total taxable value of land and additions on the property. | Land | Improvement |
|---|---|---|---|---|
| 2024 | $4,145 | $286,834 | $197,742 | $89,092 |
| 2023 | $4,145 | $279,016 | $202,058 | $76,958 |
| 2022 | $3,737 | $243,883 | $183,145 | $60,738 |
| 2021 | $3,297 | $179,119 | $0 | $0 |
| 2020 | $3,290 | $176,220 | $0 | $0 |
| 2019 | $3,030 | $160,816 | $88,237 | $72,579 |
| 2018 | $2,969 | $156,255 | $0 | $0 |
| 2017 | $2,774 | $143,752 | $0 | $0 |
| 2016 | $783 | $80,623 | $0 | $0 |
| 2015 | $797 | $80,063 | $0 | $0 |
| 2014 | -- | $79,428 | $0 | $0 |
Source: Public Records
Map
Nearby Homes
- 907 Hull St S
- 914 Freemont St S
- 1201 Freemont St S
- 1105 58th St S
- 6131 9th Ave S
- 6138 11th Ave S
- 926 62nd St S
- 624 Folsom St S
- 5820 Fairfield Ave S
- 5701 12th Ave S
- 589 59th St S
- 6202 7th Ave S
- 5614 11th Ave S
- 6213 12th Ave S
- 1517 60th St S
- 5518 11th Ave S
- 5955 5th Ave S
- 6237 13th Ave S
- 5508 11th Ave S
- 5517 13th Ave S