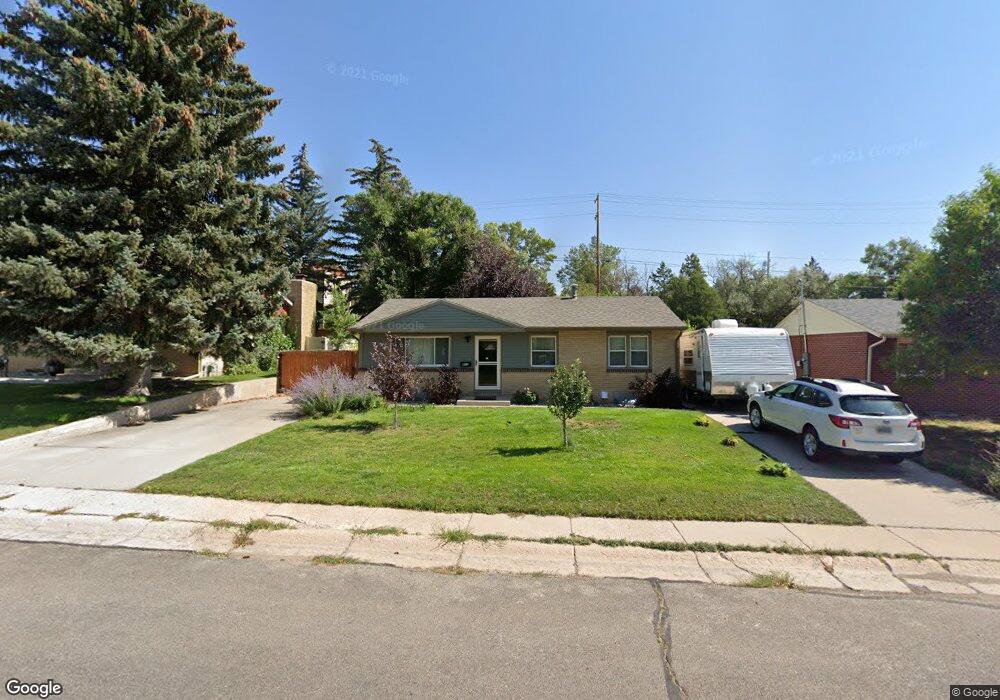
913 Hillcrest Rd Cheyenne, WY 82001
Estimated Value: $313,000 - $329,000
3
Beds
2
Baths
975
Sq Ft
$331/Sq Ft
Est. Value
About This Home
This home is located at 913 Hillcrest Rd, Cheyenne, WY 82001 and is currently estimated at $322,661, approximately $330 per square foot. 913 Hillcrest Rd is a home located in Laramie County with nearby schools including Lebhart Elementary School, Fairview Elementary School, and Johnson Junior High School.
Ownership History
Date
Name
Owned For
Owner Type
Purchase Details
Closed on
May 24, 2011
Sold by
Lolmaugh Robert and Lolmaugh Susan Marie
Bought by
Mcevoy Patricia A
Current Estimated Value
Purchase Details
Closed on
Apr 14, 2006
Sold by
Lolmaugh Robert and Lolmaugh Susan Marie
Bought by
Lolmaugh Robert and Lolmaugh Susan Marie
Home Financials for this Owner
Home Financials are based on the most recent Mortgage that was taken out on this home.
Original Mortgage
$105,600
Interest Rate
6.32%
Mortgage Type
Fannie Mae Freddie Mac
Purchase Details
Closed on
Apr 12, 2006
Sold by
Dunker Myran and Dunker Barbara A
Bought by
Lolmaugh Robert
Home Financials for this Owner
Home Financials are based on the most recent Mortgage that was taken out on this home.
Original Mortgage
$105,600
Interest Rate
6.32%
Mortgage Type
Fannie Mae Freddie Mac
Purchase Details
Closed on
Nov 30, 2001
Sold by
Taylor Jeffrey Jude and Taylor Debra Anne
Bought by
Dunker Myran and Dunker Barbara A
Create a Home Valuation Report for This Property
The Home Valuation Report is an in-depth analysis detailing your home's value as well as a comparison with similar homes in the area
Home Values in the Area
Average Home Value in this Area
Purchase History
| Date | Buyer | Sale Price | Title Company |
|---|---|---|---|
| Mcevoy Patricia A | -- | None Available | |
| Lolmaugh Robert | -- | Summit Title Services | |
| Lolmaugh Robert | -- | Summit Title Services | |
| Dunker Myran | -- | -- |
Source: Public Records
Mortgage History
| Date | Status | Borrower | Loan Amount |
|---|---|---|---|
| Previous Owner | Lolmaugh Robert | $105,600 |
Source: Public Records
Tax History Compared to Growth
Tax History
| Year | Tax Paid | Tax Assessment Tax Assessment Total Assessment is a certain percentage of the fair market value that is determined by local assessors to be the total taxable value of land and additions on the property. | Land | Improvement |
|---|---|---|---|---|
| 2025 | $1,743 | $19,093 | $3,687 | $15,406 |
| 2024 | $1,743 | $24,656 | $4,916 | $19,740 |
| 2023 | $1,726 | $24,414 | $4,916 | $19,498 |
| 2022 | $1,651 | $22,867 | $4,916 | $17,951 |
| 2021 | $1,509 | $20,863 | $4,916 | $15,947 |
| 2020 | $1,402 | $19,438 | $4,916 | $14,522 |
| 2019 | $1,300 | $18,008 | $4,916 | $13,092 |
| 2018 | $1,145 | $16,012 | $3,728 | $12,284 |
| 2017 | $1,114 | $15,441 | $3,025 | $12,416 |
| 2016 | $1,092 | $15,129 | $2,974 | $12,155 |
| 2015 | $1,005 | $13,916 | $2,974 | $10,942 |
| 2014 | $996 | $13,703 | $2,974 | $10,729 |
Source: Public Records
Map
Nearby Homes
- 840 Stevens Dr
- 3331 Belaire Ave
- 810 Cahill Dr
- 3428 E 11th St
- 3429 E 12th St
- Lot 2 E 13th St
- 3002 Homestead Ave
- 3251 Fir Dr
- 1175 Long Valley Rd
- 1301 Diamond Ave
- 1125 Rosebud Rd
- 711 Monroe Ave
- 1426 Adams Ave
- 3241 Acacia Dr
- 1442 Monroe Ct
- 4318 E 8th St
- 2908 E 8th St
- 3248 Acacia Dr
- 828 Cleveland Ave
- 2804 E 10th St
- 919 Hillcrest Rd
- 907 Hillcrest Rd
- 925 Hillcrest Rd
- 903 Hillcrest Rd
- 843 Hillcrest Rd
- 931 Hillcrest Rd
- 914 Hillcrest Rd
- 816 Worth Dr
- 812 Worth Dr
- 920 Hillcrest Rd
- 820 Worth Dr
- 926 Hillcrest Rd
- 808 Worth Dr
- 904 Hillcrest Rd
- 900 Worth Dr
- 837 Hillcrest Rd
- 844 Hillcrest Rd
- 804 Worth Dr
- 904 Worth Dr
- 915 Stevens Dr