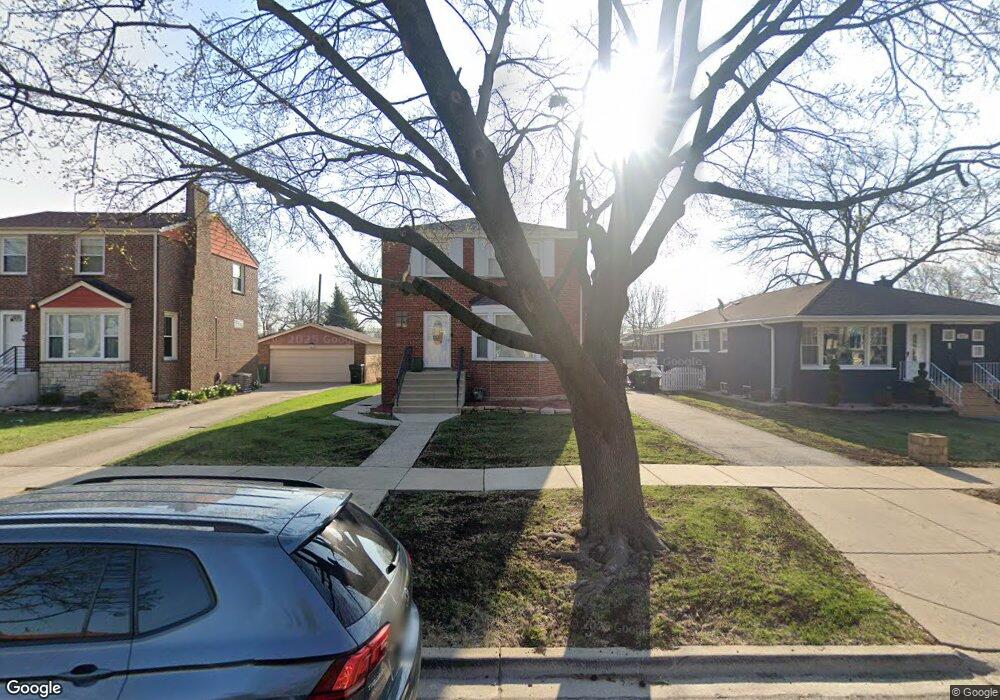
913 Hull Ave Westchester, IL 60154
Estimated Value: $265,000 - $320,000
2
Beds
1
Bath
1,216
Sq Ft
$241/Sq Ft
Est. Value
About This Home
This home is located at 913 Hull Ave, Westchester, IL 60154 and is currently estimated at $293,130, approximately $241 per square foot. 913 Hull Ave is a home located in Cook County with nearby schools including Westchester Primary School, Westchester Intermediate School, and Westchester Middle School.
Ownership History
Date
Name
Owned For
Owner Type
Purchase Details
Closed on
Apr 24, 2017
Sold by
Walker David L
Bought by
Smith Andre I
Current Estimated Value
Home Financials for this Owner
Home Financials are based on the most recent Mortgage that was taken out on this home.
Original Mortgage
$152,000
Outstanding Balance
$126,625
Interest Rate
4.25%
Mortgage Type
New Conventional
Estimated Equity
$166,505
Purchase Details
Closed on
Mar 30, 1999
Sold by
Smith Douglas W and Smith Maria T
Bought by
Walker David L
Home Financials for this Owner
Home Financials are based on the most recent Mortgage that was taken out on this home.
Original Mortgage
$113,400
Interest Rate
6.89%
Create a Home Valuation Report for This Property
The Home Valuation Report is an in-depth analysis detailing your home's value as well as a comparison with similar homes in the area
Home Values in the Area
Average Home Value in this Area
Purchase History
| Date | Buyer | Sale Price | Title Company |
|---|---|---|---|
| Smith Andre I | $160,000 | Attorney | |
| Walker David L | $117,500 | -- |
Source: Public Records
Mortgage History
| Date | Status | Borrower | Loan Amount |
|---|---|---|---|
| Open | Smith Andre I | $152,000 | |
| Previous Owner | Walker David L | $113,400 |
Source: Public Records
Tax History Compared to Growth
Tax History
| Year | Tax Paid | Tax Assessment Tax Assessment Total Assessment is a certain percentage of the fair market value that is determined by local assessors to be the total taxable value of land and additions on the property. | Land | Improvement |
|---|---|---|---|---|
| 2024 | $5,774 | $22,001 | $4,188 | $17,813 |
| 2023 | $5,180 | $22,001 | $4,188 | $17,813 |
| 2022 | $5,180 | $16,977 | $3,685 | $13,292 |
| 2021 | $5,014 | $16,977 | $3,685 | $13,292 |
| 2020 | $4,898 | $16,977 | $3,685 | $13,292 |
| 2019 | $5,265 | $18,636 | $3,350 | $15,286 |
| 2018 | $5,196 | $18,636 | $3,350 | $15,286 |
| 2017 | $4,173 | $18,636 | $3,350 | $15,286 |
| 2016 | $3,856 | $15,720 | $3,015 | $12,705 |
| 2015 | $3,771 | $15,720 | $3,015 | $12,705 |
| 2014 | $3,699 | $15,720 | $3,015 | $12,705 |
| 2013 | $3,932 | $18,272 | $3,015 | $15,257 |
Source: Public Records
Map
Nearby Homes
- 920 Suffolk Ave
- 1119 Newcastle Ave
- 723 Balmoral Ave
- 814 Norfolk Ave
- 805 Norfolk Ave
- 10072 Drury Ln
- 923 Manchester Ave
- 1136 Park Place
- 626 Manchester Ave
- 750 Bristol Ave
- 1102 Marshall Ave
- 1035 Bohland Ave
- 1247 S Mannheim Rd Unit 3
- 1108 31st Ave
- 1102 31st Ave
- 1023 Rice Ave
- 1022 Eastern Ave
- 1013 Bellwood Ave
- 1034 31st Ave
- 942 Bellwood Ave