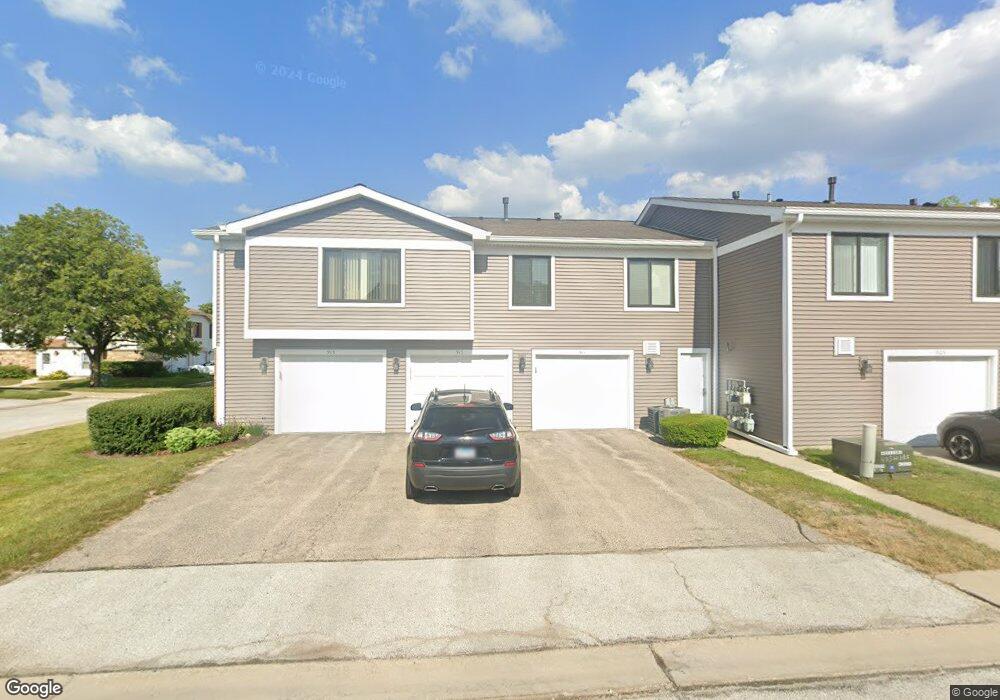
913 Jackson Ct Unit 101 Vernon Hills, IL 60061
Estimated Value: $278,000 - $291,000
3
Beds
2
Baths
1,200
Sq Ft
$237/Sq Ft
Est. Value
About This Home
This home is located at 913 Jackson Ct Unit 101, Vernon Hills, IL 60061 and is currently estimated at $284,553, approximately $237 per square foot. 913 Jackson Ct Unit 101 is a home located in Lake County with nearby schools including Hawthorn School Of Dual Language, Hawthorn Townline Elementary School, and Hawthorn Middle School North.
Ownership History
Date
Name
Owned For
Owner Type
Purchase Details
Closed on
Jan 24, 2011
Sold by
Hsbc Mortgage Services Inc
Bought by
The Chicago Trust Company Na and Trust #Sbl-3251
Current Estimated Value
Purchase Details
Closed on
Dec 28, 2010
Sold by
Bahena Justina
Bought by
Hsbc Mortgage Services Inc
Purchase Details
Closed on
Apr 30, 2004
Sold by
Buchanan Wilson F and Buchanan Katherine A
Bought by
Bahena Justina
Home Financials for this Owner
Home Financials are based on the most recent Mortgage that was taken out on this home.
Original Mortgage
$179,550
Interest Rate
6.55%
Mortgage Type
Purchase Money Mortgage
Purchase Details
Closed on
Jun 24, 1999
Sold by
Buchanan Katherine A and Buchanan Wilson F
Bought by
Wilson F Buchanan Trust
Purchase Details
Closed on
Sep 26, 1996
Sold by
Greissinger Gary S and Greissinger Dolores J
Bought by
Buchanan Wilson F and Buchanan Katherine A
Create a Home Valuation Report for This Property
The Home Valuation Report is an in-depth analysis detailing your home's value as well as a comparison with similar homes in the area
Home Values in the Area
Average Home Value in this Area
Purchase History
| Date | Buyer | Sale Price | Title Company |
|---|---|---|---|
| The Chicago Trust Company Na | $95,500 | Forum Title Insurance Co | |
| Hsbc Mortgage Services Inc | -- | None Available | |
| Bahena Justina | $190,000 | Attorneys Title Guaranty Fun | |
| Wilson F Buchanan Trust | -- | -- | |
| Katherine Anne Buchanan Trust | -- | -- | |
| Buchanan Wilson F | $102,000 | -- |
Source: Public Records
Mortgage History
| Date | Status | Borrower | Loan Amount |
|---|---|---|---|
| Previous Owner | Bahena Justina | $179,550 |
Source: Public Records
Tax History Compared to Growth
Tax History
| Year | Tax Paid | Tax Assessment Tax Assessment Total Assessment is a certain percentage of the fair market value that is determined by local assessors to be the total taxable value of land and additions on the property. | Land | Improvement |
|---|---|---|---|---|
| 2024 | $6,546 | $75,955 | $25,980 | $49,975 |
| 2023 | $5,529 | $70,056 | $23,962 | $46,094 |
| 2022 | $5,529 | $59,230 | $23,033 | $36,197 |
| 2021 | $5,297 | $57,955 | $22,537 | $35,418 |
| 2020 | $5,109 | $56,981 | $22,158 | $34,823 |
| 2019 | $4,979 | $56,439 | $21,947 | $34,492 |
| 2018 | $4,171 | $47,347 | $21,857 | $25,490 |
| 2017 | $4,051 | $45,852 | $21,167 | $24,685 |
| 2016 | $3,896 | $43,474 | $20,069 | $23,405 |
| 2015 | $3,852 | $40,634 | $18,758 | $21,876 |
| 2014 | $3,106 | $31,999 | $18,506 | $13,493 |
| 2012 | $2,859 | $32,277 | $18,667 | $13,610 |
Source: Public Records
Map
Nearby Homes
- 365 Jefferson Ct Unit 65
- 464 Buchanan Ct
- 1028 Cumberland Ct
- 139 Windsor Dr Unit 123
- 717 Summit Ln
- 1049 Kingston Ct
- 15 Crestview Ln Unit 4
- 1109 Grant Place
- 608 Sycamore St
- 4 Parkside Ct Unit 12
- 1434 Maidstone Dr
- 900 S Butterfield Rd
- 668 Portage Ct Unit 345
- 580 Muskegan Ct Unit 401
- 307 Albright Ct
- 227 Augusta Dr
- 1303 Orleans Dr Unit 1303
- 602 Muskegan Ct Unit 387
- 1220 Orleans Dr Unit 1220
- 872 Lansing Ct Unit 151
- 915 Jackson Ct
- 911 Jackson Ct Unit 100
- 905 Jackson Ct Unit 99
- 903 Jackson Ct Unit 98
- 901 Jackson Ct
- 912 Jackson Ct Unit 106
- 404 Buchanan Ct Unit 119
- 402 Buchanan Ct Unit 120
- 406 Buchanan Ct Unit 118
- 412 Buchanan Ct Unit 117
- 934 Adams Ct Unit 95
- 932 Adams Ct Unit 94
- 416 Buchanan Ct Unit 115
- 936 Adams Ct Unit 96
- 936 Adams Ct Unit 936
- 414 Buchanan Ct Unit 116
- 930 Adams Ct Unit 93
- 384 Washington Ct Unit 86
- 928 Adams Ct
- 926 Adams Ct Unit 91