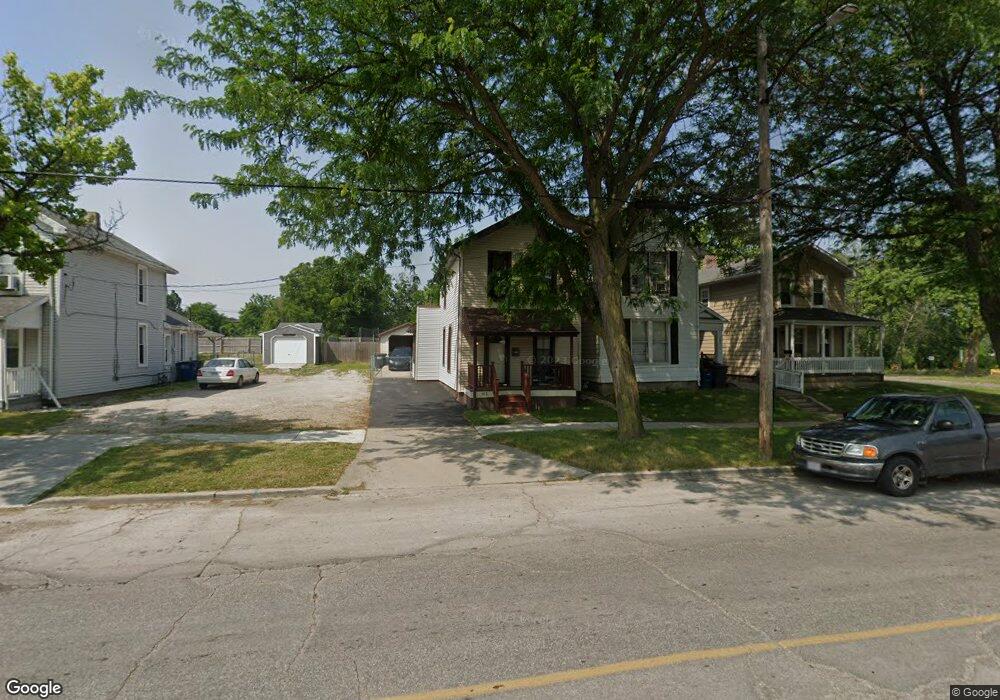
913 Lagrange St Toledo, OH 43604
Lagrange NeighborhoodEstimated Value: $44,234 - $70,000
3
Beds
1
Bath
1,144
Sq Ft
$46/Sq Ft
Est. Value
About This Home
This home is located at 913 Lagrange St, Toledo, OH 43604 and is currently estimated at $52,059, approximately $45 per square foot. 913 Lagrange St is a home located in Lucas County with nearby schools including Riverside Elementary School, Woodward High School, and The Maritime Academy of Toledo.
Ownership History
Date
Name
Owned For
Owner Type
Purchase Details
Closed on
Jun 30, 2021
Sold by
Floyd Tammy L and Floyd Carl A
Bought by
Quiroga David
Current Estimated Value
Purchase Details
Closed on
Jun 29, 2021
Sold by
Lawson William and Lawson Linda L
Bought by
Lawson Tammy
Purchase Details
Closed on
Dec 28, 2018
Sold by
The Lucas County Land Reutilization Corp
Bought by
Lawson Tammy
Purchase Details
Closed on
Jan 9, 1989
Sold by
Falbo Anthony
Create a Home Valuation Report for This Property
The Home Valuation Report is an in-depth analysis detailing your home's value as well as a comparison with similar homes in the area
Home Values in the Area
Average Home Value in this Area
Purchase History
| Date | Buyer | Sale Price | Title Company |
|---|---|---|---|
| Quiroga David | $25,000 | None Listed On Document | |
| Lawson Tammy | -- | None Available | |
| Lawson Tammy | -- | None Available | |
| -- | $100 | -- |
Source: Public Records
Tax History Compared to Growth
Tax History
| Year | Tax Paid | Tax Assessment Tax Assessment Total Assessment is a certain percentage of the fair market value that is determined by local assessors to be the total taxable value of land and additions on the property. | Land | Improvement |
|---|---|---|---|---|
| 2024 | $486 | $15,400 | $2,275 | $13,125 |
| 2023 | $649 | $9,415 | $1,785 | $7,630 |
| 2022 | $651 | $9,415 | $1,785 | $7,630 |
| 2021 | $664 | $9,415 | $1,785 | $7,630 |
| 2020 | $636 | $7,805 | $1,470 | $6,335 |
| 2019 | $608 | $7,700 | $1,365 | $6,335 |
| 2018 | $620 | $7,700 | $1,365 | $6,335 |
| 2017 | $624 | $7,525 | $1,120 | $6,405 |
| 2016 | $631 | $21,500 | $3,200 | $18,300 |
| 2015 | $627 | $21,500 | $3,200 | $18,300 |
| 2014 | $474 | $7,530 | $1,120 | $6,410 |
| 2013 | $474 | $7,530 | $1,120 | $6,410 |
Source: Public Records
Map
Nearby Homes
- 522 Locust St
- 1238 N Ontario St
- 1510 Walnut St
- 1114 N Superior St
- 1431 N Michigan St
- 1721 Walnut St
- 1029 Sherman St
- 1463 N Ontario St
- 811 Bush St
- 809 Bush St
- 1449 N Superior St
- 624 Bush St
- 1130 Page St
- 1219 Peck St
- 914 Moore St
- 2017 Locust St
- 2005 Walnut St
- 721 Stickney Ave
- 1631 N Erie St
- 1431 Moore St
- 917 Lagrange St
- 919 Lagrange St
- 931 N Michigan St
- 923 Lagrange St
- 901 Lagrange St
- 929 N Michigan St
- 914 Lagrange St
- 906 Lagrange St
- 831 Lagrange St
- 1011 N Michigan St
- 934 N Michigan St
- 1001 Champlain St
- 1002 Lagrange St
- 823 Lagrange St
- 914 Locust St
- 910 Locust St
- 906 Locust St
- 828 Lagrange St
- 902 Locust St
- 1017 N Michigan St