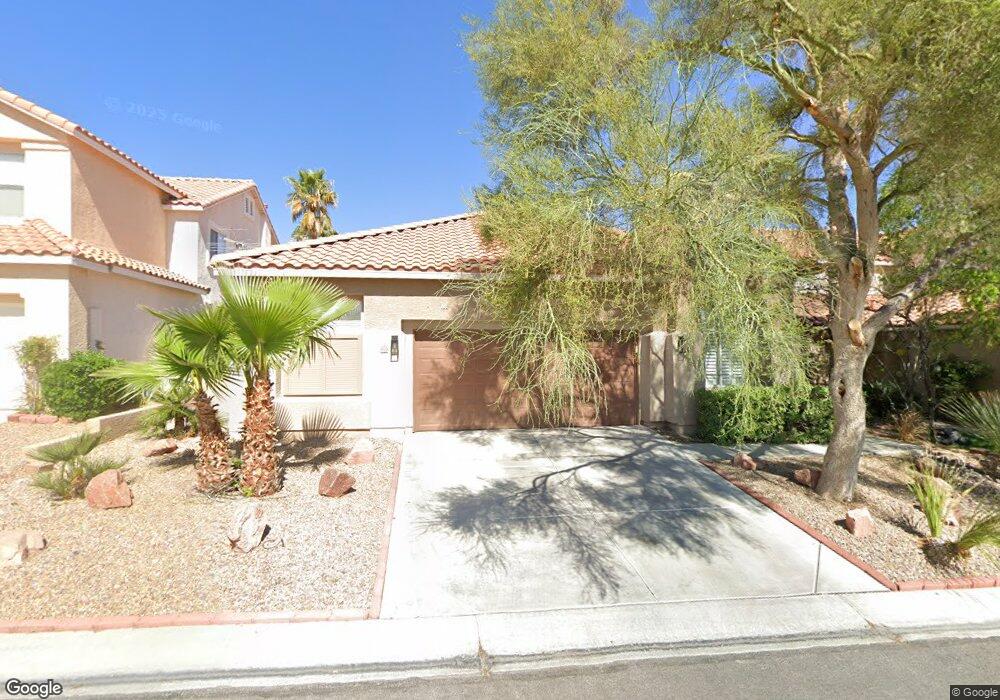
913 Lexington Cross Dr Unit home Las Vegas, NV 89144
Summerlin NeighborhoodEstimated Value: $631,767
3
Beds
2
Baths
2,040
Sq Ft
$310/Sq Ft
Est. Value
About This Home
This home is located at 913 Lexington Cross Dr Unit home, Las Vegas, NV 89144 and is currently priced at $631,767, approximately $309 per square foot. 913 Lexington Cross Dr Unit home is a home located in Clark County with nearby schools including John W. Bonner Elementary School, Sig Rogich Middle School, and Palo Verde High School.
Ownership History
Date
Name
Owned For
Owner Type
Purchase Details
Closed on
Nov 8, 2023
Sold by
James S Vitale Trust
Bought by
Acf Separate Property Trust and Fleury
Current Estimated Value
Home Financials for this Owner
Home Financials are based on the most recent Mortgage that was taken out on this home.
Original Mortgage
$420,000
Outstanding Balance
$385,230
Interest Rate
6.72%
Mortgage Type
New Conventional
Purchase Details
Closed on
Dec 29, 2015
Sold by
Cupp Jacqueline E and Vitale James
Bought by
Vitale James
Home Financials for this Owner
Home Financials are based on the most recent Mortgage that was taken out on this home.
Original Mortgage
$200,000
Interest Rate
3.92%
Mortgage Type
New Conventional
Purchase Details
Closed on
May 22, 2012
Sold by
Cupp Jacqueline E
Bought by
Lexington Cross Drive Trust
Purchase Details
Closed on
Jun 3, 2009
Sold by
Fulford Shelly A
Bought by
Cupp Jacqueline E
Home Financials for this Owner
Home Financials are based on the most recent Mortgage that was taken out on this home.
Original Mortgage
$184,000
Interest Rate
4.78%
Mortgage Type
Unknown
Purchase Details
Closed on
Aug 15, 2005
Sold by
Mclauchlin Edythe Joy and Mclaughlin Edythe Joy
Bought by
Fulford Shelly A
Home Financials for this Owner
Home Financials are based on the most recent Mortgage that was taken out on this home.
Original Mortgage
$347,000
Interest Rate
5.64%
Mortgage Type
Fannie Mae Freddie Mac
Purchase Details
Closed on
Apr 16, 2003
Sold by
Vanbiber John C and Vanbiber Cynthia K
Bought by
Mclaughlin Edythe Joy
Home Financials for this Owner
Home Financials are based on the most recent Mortgage that was taken out on this home.
Original Mortgage
$265,000
Interest Rate
5.54%
Purchase Details
Closed on
Sep 16, 2002
Sold by
Olariu Paul M and Olariu Laura J
Bought by
Vanbiber John C and Vanbiber Cynthia K
Home Financials for this Owner
Home Financials are based on the most recent Mortgage that was taken out on this home.
Original Mortgage
$204,000
Interest Rate
6.24%
Purchase Details
Closed on
Jan 15, 1997
Sold by
Pardee Construction Company Of Nevada
Bought by
Olariu Paul M and Olariu Laura J
Home Financials for this Owner
Home Financials are based on the most recent Mortgage that was taken out on this home.
Original Mortgage
$163,149
Interest Rate
7.46%
Mortgage Type
VA
Create a Home Valuation Report for This Property
The Home Valuation Report is an in-depth analysis detailing your home's value as well as a comparison with similar homes in the area
Home Values in the Area
Average Home Value in this Area
Purchase History
| Date | Buyer | Sale Price | Title Company |
|---|---|---|---|
| Acf Separate Property Trust | $620,000 | Chicago Title | |
| Vitale James | -- | Title Source Inc | |
| Lexington Cross Drive Trust | -- | None Available | |
| Cupp Jacqueline E | -- | None Available | |
| Cupp Jacqueline E | $230,000 | Noble Title | |
| Fulford Shelly A | $465,000 | Fidelity National Title | |
| Mclaughlin Edythe Joy | $265,000 | Nevada Title Company | |
| Vanbiber John C | $255,000 | First American Title Co | |
| Olariu Paul M | $160,000 | Land Title |
Source: Public Records
Mortgage History
| Date | Status | Borrower | Loan Amount |
|---|---|---|---|
| Open | Acf Separate Property Trust | $420,000 | |
| Previous Owner | Vitale James | $200,000 | |
| Previous Owner | Cupp Jacqueline E | $184,000 | |
| Previous Owner | Fulford Shelly A | $347,000 | |
| Previous Owner | Mclaughlin Edythe Joy | $265,000 | |
| Previous Owner | Vanbiber John C | $204,000 | |
| Previous Owner | Olariu Paul M | $163,149 | |
| Closed | Vanbiber John C | $25,500 |
Source: Public Records
Tax History Compared to Growth
Tax History
| Year | Tax Paid | Tax Assessment Tax Assessment Total Assessment is a certain percentage of the fair market value that is determined by local assessors to be the total taxable value of land and additions on the property. | Land | Improvement |
|---|---|---|---|---|
| 2025 | $3,878 | $148,950 | $60,900 | $88,050 |
| 2024 | $3,592 | $148,950 | $60,900 | $88,050 |
| 2023 | $3,592 | $136,194 | $52,850 | $83,344 |
| 2022 | $3,487 | $115,974 | $39,200 | $76,774 |
| 2021 | $3,229 | $109,525 | $36,400 | $73,125 |
| 2020 | $2,995 | $107,963 | $35,350 | $72,613 |
| 2019 | $2,807 | $104,545 | $32,900 | $71,645 |
| 2018 | $2,679 | $97,370 | $28,000 | $69,370 |
| 2017 | $3,047 | $92,768 | $22,400 | $70,368 |
| 2016 | $2,507 | $92,305 | $21,700 | $70,605 |
| 2015 | $2,502 | $88,214 | $18,900 | $69,314 |
| 2014 | $2,429 | $76,860 | $13,300 | $63,560 |
Source: Public Records
Map
Nearby Homes
- 10400 Beachwalk Place
- 916 Autumn Royal Ln
- 10424 Beachwalk Place
- 901 Cambridge Cross Place
- 10505 Prime View Ct
- 10501 Pacific Palisades Ave
- 10600 Olivebranch Ave
- 10247 Amber Hue Ln
- 10432 American Falls Ln
- 425 Blush Creek Place
- 412 Carlton Kay Place
- 428 Madison Taylor Place
- 10224 Anoka Ave
- 901 Royal Birch Ln Unit 1
- 407 Red Canvas Place
- 505 Crimson View Place
- 10645 Redwood Grove Ave
- 10129 Oakmoor Place
- 10657 Blue Nile Ct
- 1532 Waterton Dr
- 913 Lexington Cross Dr
- 909 Lexington Cross Dr
- 917 Lexington Cross Dr
- 905 Lexington Cross Dr
- 921 Lexington Cross Dr
- 912 Lexington Cross Dr
- 901 Lexington Cross Dr
- 925 Lexington Cross Dr
- 908 Lexington Cross Dr Unit 9999
- 908 Lexington Cross Dr
- 900 Lexington Cross Dr
- 920 Cambridge Cross Place
- 821 Lexington Cross Dr
- 940 Midpride St
- 936 Midpride St
- 820 Lexington Cross Dr
- 932 Midpride St
- 909 Cambridge Cross Place
- 916 Cambridge Cross Place
- 928 Midpride St