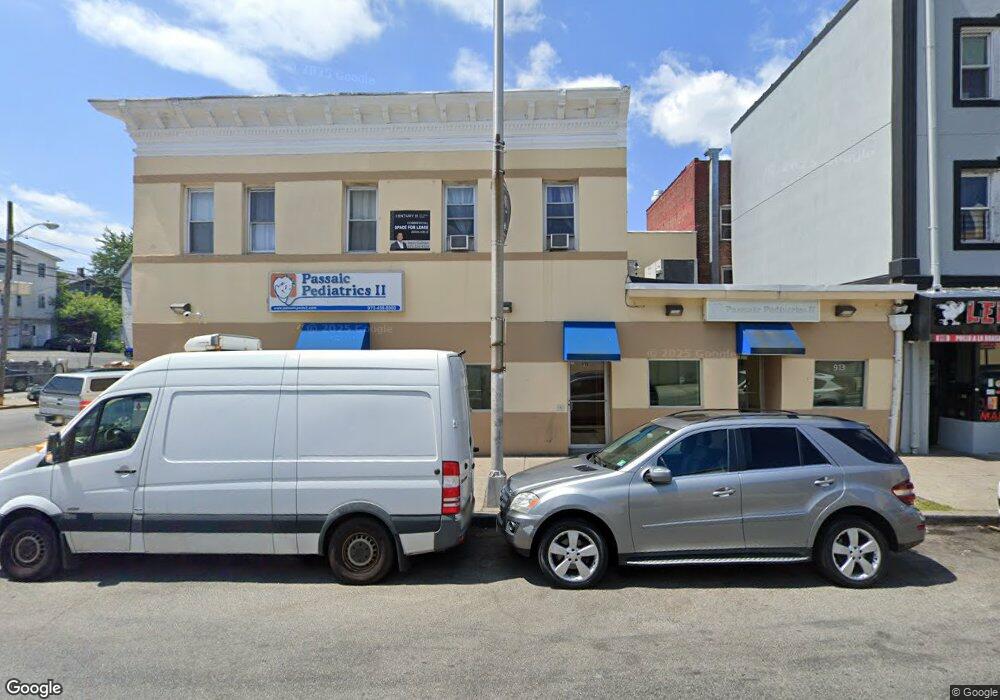
913 Main Ave Unit 2nd F Passaic, NJ 07055
Estimated Value: $826,808
--
Bed
--
Bath
1,750
Sq Ft
$472/Sq Ft
Est. Value
About This Home
This home is located at 913 Main Ave Unit 2nd F, Passaic, NJ 07055 and is currently estimated at $826,808, approximately $472 per square foot. 913 Main Ave Unit 2nd F is a home located in Passaic County with nearby schools including Passaic High School # 12, Passaic Arts and Science Charter School, and St Nicholas Ukrainian Catholic School.
Ownership History
Date
Name
Owned For
Owner Type
Purchase Details
Closed on
Feb 13, 2003
Sold by
Milmiles Realty
Bought by
Passaic Kids Realty
Current Estimated Value
Home Financials for this Owner
Home Financials are based on the most recent Mortgage that was taken out on this home.
Original Mortgage
$259,000
Outstanding Balance
$110,842
Interest Rate
5.94%
Mortgage Type
Commercial
Estimated Equity
$715,966
Create a Home Valuation Report for This Property
The Home Valuation Report is an in-depth analysis detailing your home's value as well as a comparison with similar homes in the area
Home Values in the Area
Average Home Value in this Area
Purchase History
| Date | Buyer | Sale Price | Title Company |
|---|---|---|---|
| Passaic Kids Realty | $370,000 | -- |
Source: Public Records
Mortgage History
| Date | Status | Borrower | Loan Amount |
|---|---|---|---|
| Open | Passaic Kids Realty | $259,000 |
Source: Public Records
Tax History Compared to Growth
Tax History
| Year | Tax Paid | Tax Assessment Tax Assessment Total Assessment is a certain percentage of the fair market value that is determined by local assessors to be the total taxable value of land and additions on the property. | Land | Improvement |
|---|---|---|---|---|
| 2025 | $41,861 | $1,015,300 | $192,900 | $822,400 |
| 2024 | $40,653 | $1,015,300 | $192,900 | $822,400 |
| 2022 | $39,434 | $1,015,300 | $192,900 | $822,400 |
| 2021 | $38,175 | $1,015,300 | $192,900 | $822,400 |
| 2020 | $37,881 | $1,015,300 | $192,900 | $822,400 |
| 2019 | $37,333 | $1,015,300 | $192,900 | $822,400 |
| 2018 | $36,530 | $1,015,300 | $192,900 | $822,400 |
| 2017 | $35,404 | $1,015,300 | $192,900 | $822,400 |
| 2016 | $34,195 | $1,015,300 | $192,900 | $822,400 |
| 2015 | $21,204 | $280,000 | $61,700 | $218,300 |
| 2014 | $20,815 | $280,000 | $61,700 | $218,300 |
Source: Public Records
Map
Nearby Homes