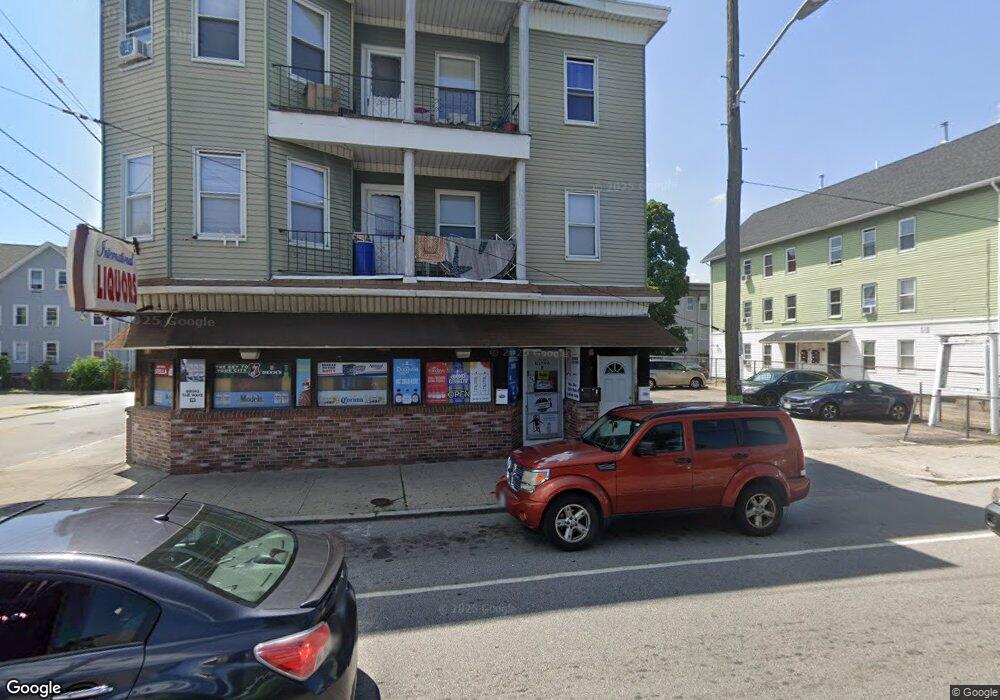
913 Main St Pawtucket, RI 02860
Woodlawn NeighborhoodEstimated Value: $800,626
8
Beds
5
Baths
5,073
Sq Ft
$158/Sq Ft
Est. Value
About This Home
This home is located at 913 Main St, Pawtucket, RI 02860 and is currently estimated at $800,626, approximately $157 per square foot. 913 Main St is a home located in Providence County with nearby schools including International Charter School, Blackstone Valley Prep Junior High School, and Blackstone Academy Charter School.
Ownership History
Date
Name
Owned For
Owner Type
Purchase Details
Closed on
Aug 10, 2022
Sold by
Alves Emidio S and Alves Maria M
Bought by
Lja Realty Llc
Current Estimated Value
Purchase Details
Closed on
May 23, 2001
Sold by
Xavier John and Xavier Martha
Bought by
Alves Emidio S and Alves Maria M
Home Financials for this Owner
Home Financials are based on the most recent Mortgage that was taken out on this home.
Original Mortgage
$100,000
Interest Rate
7.05%
Mortgage Type
Commercial
Create a Home Valuation Report for This Property
The Home Valuation Report is an in-depth analysis detailing your home's value as well as a comparison with similar homes in the area
Home Values in the Area
Average Home Value in this Area
Purchase History
| Date | Buyer | Sale Price | Title Company |
|---|---|---|---|
| Lja Realty Llc | $600,000 | None Available | |
| Lja Realty Llc | $600,000 | None Available | |
| Alves Emidio S | $180,000 | -- | |
| Alves Emidio S | $180,000 | -- |
Source: Public Records
Mortgage History
| Date | Status | Borrower | Loan Amount |
|---|---|---|---|
| Previous Owner | Alves Emidio S | $260,000 | |
| Previous Owner | Alves Emidio S | $100,000 |
Source: Public Records
Tax History Compared to Growth
Tax History
| Year | Tax Paid | Tax Assessment Tax Assessment Total Assessment is a certain percentage of the fair market value that is determined by local assessors to be the total taxable value of land and additions on the property. | Land | Improvement |
|---|---|---|---|---|
| 2025 | $7,177 | $545,800 | $92,200 | $453,600 |
| 2024 | -- | $545,800 | $92,200 | $453,600 |
| 2023 | $0 | $301,300 | $76,600 | $224,700 |
| 2022 | $0 | $301,300 | $76,600 | $224,700 |
| 2021 | $0 | $301,300 | $76,600 | $224,700 |
| 2020 | $0 | $273,400 | $76,600 | $196,800 |
| 2019 | $6,937 | $273,400 | $76,600 | $196,800 |
| 2018 | $0 | $273,400 | $76,600 | $196,800 |
| 2017 | $0 | $275,900 | $79,800 | $196,100 |
| 2016 | -- | $275,900 | $79,800 | $196,100 |
| 2015 | -- | $275,900 | $79,800 | $196,100 |
| 2014 | -- | $312,200 | $86,700 | $225,500 |
Source: Public Records
Map
Nearby Homes