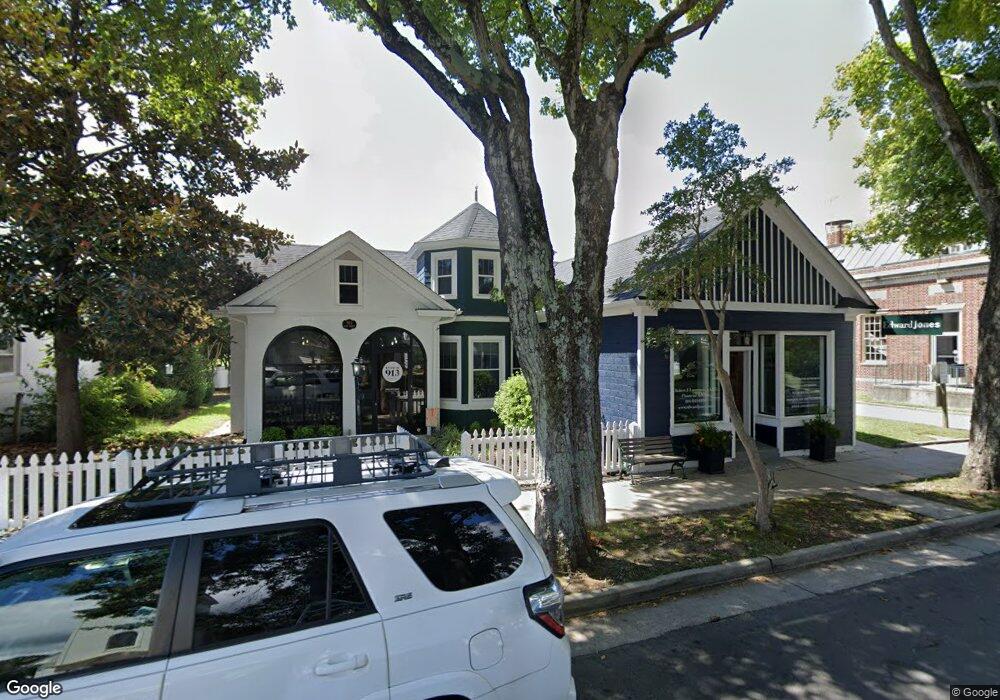
913 Main St West Point, VA 23181
Estimated Value: $239,751
Studio
--
Bath
1,825
Sq Ft
$131/Sq Ft
Est. Value
About This Home
This home is located at 913 Main St, West Point, VA 23181 and is currently estimated at $239,751, approximately $131 per square foot. 913 Main St is a home located in King William County with nearby schools including West Point Elementary School, West Point Middle School, and West Point High School.
Ownership History
Date
Name
Owned For
Owner Type
Purchase Details
Closed on
Dec 10, 2020
Sold by
Olsson Realty Llc
Bought by
913 Main Street Llc
Current Estimated Value
Home Financials for this Owner
Home Financials are based on the most recent Mortgage that was taken out on this home.
Original Mortgage
$148,750
Outstanding Balance
$132,432
Interest Rate
2.7%
Mortgage Type
Amount Keyed Is An Aggregate Amount
Estimated Equity
$107,319
Create a Home Valuation Report for This Property
The Home Valuation Report is an in-depth analysis detailing your home's value as well as a comparison with similar homes in the area
Home Values in the Area
Average Home Value in this Area
Purchase History
| Date | Buyer | Sale Price | Title Company |
|---|---|---|---|
| 913 Main Street Llc | $175,000 | Attorney |
Source: Public Records
Mortgage History
| Date | Status | Borrower | Loan Amount |
|---|---|---|---|
| Open | 913 Main Street Llc | $148,750 |
Source: Public Records
Tax History
| Year | Tax Paid | Tax Assessment Tax Assessment Total Assessment is a certain percentage of the fair market value that is determined by local assessors to be the total taxable value of land and additions on the property. | Land | Improvement |
|---|---|---|---|---|
| 2025 | $516 | $169,100 | $45,000 | $124,100 |
| 2024 | $457 | $169,100 | $45,000 | $124,100 |
| 2023 | $457 | $169,100 | $45,000 | $124,100 |
| 2022 | $562 | $149,900 | $45,000 | $104,900 |
| 2021 | $570 | $149,899 | $45,000 | $104,899 |
| 2020 | $570 | $80,000 | $80,000 | $0 |
| 2019 | $570 | $45,000 | $45,000 | $0 |
| 2018 | $585 | $149,900 | $45,000 | $104,900 |
| 2017 | $607 | $149,900 | $45,000 | $104,900 |
| 2016 | $615 | $149,900 | $45,000 | $104,900 |
| 2015 | $645 | $149,900 | $45,000 | $104,900 |
| 2014 | $514 | $0 | $0 | $0 |
Source: Public Records
Map
Nearby Homes
- 0 14th and Kirby St
- 418 4th St
- 431 18th St
- 200 Lee St
- Lot 23 Glen St
- 00 Glen St
- 300 Thompson Ave
- 8020 Station Point Dr
- 19390 York Rd
- 352 Ogden St
- 332 Ogden St
- 322 Ogden St
- 7957 Pennsylvania Ave
- 7969 Pennsylvania Ave
- 342 Ogden St
- 314 Ogden St
- 2510 Oak Ln
- 2660 N Oak Ln
- Lot 52G Georgia Ave
- 8325 Mill Creek Rd Unit A
Your Personal Tour Guide
Ask me questions while you tour the home.