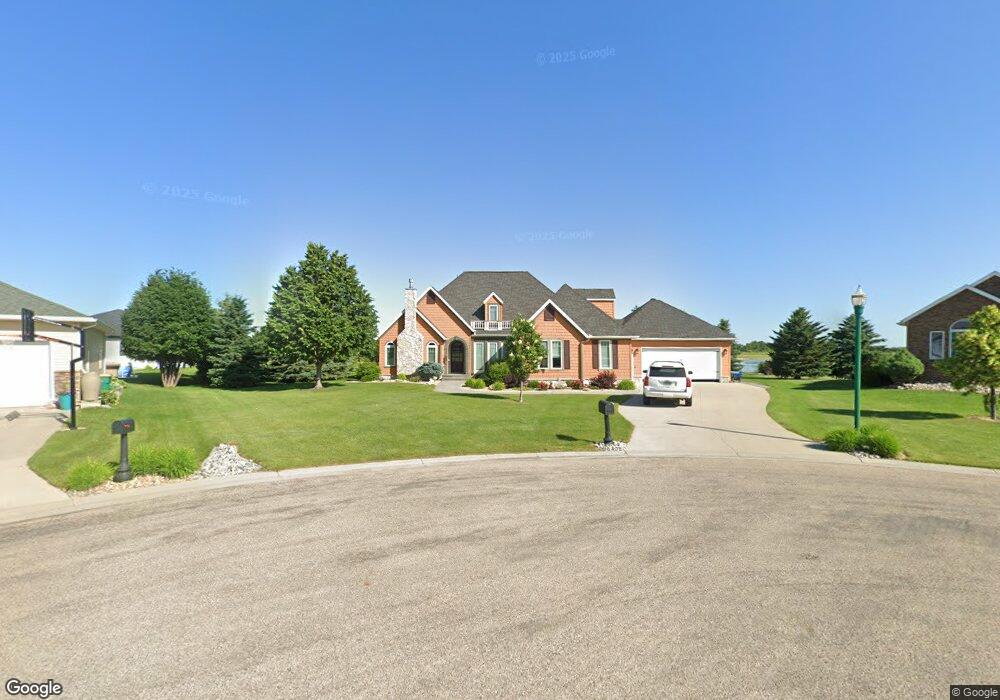
913 Maple River Ct Mapleton, ND 58059
Estimated Value: $630,000 - $799,000
4
Beds
4
Baths
3,350
Sq Ft
$220/Sq Ft
Est. Value
About This Home
This home is located at 913 Maple River Ct, Mapleton, ND 58059 and is currently estimated at $735,618, approximately $219 per square foot. 913 Maple River Ct is a home located in Cass County with nearby schools including Mapleton Elementary School.
Ownership History
Date
Name
Owned For
Owner Type
Purchase Details
Closed on
May 19, 2009
Sold by
Deutsche Bank National Trust Company
Bought by
Kasowski Steven and Kasowski Suzanna
Current Estimated Value
Purchase Details
Closed on
May 15, 2009
Sold by
Gudmunson Sheldon L and Silvernagel Jerome
Bought by
Deutsche Bank National Trust Co
Purchase Details
Closed on
Aug 28, 2006
Sold by
Gudmunson Sheldon L
Bought by
Silvernagel Jerome
Purchase Details
Closed on
May 3, 2006
Sold by
Brewer Annette and Brewer Jonathan D
Bought by
Gudmunson Sheldon L
Home Financials for this Owner
Home Financials are based on the most recent Mortgage that was taken out on this home.
Original Mortgage
$420,000
Interest Rate
8.75%
Mortgage Type
Adjustable Rate Mortgage/ARM
Create a Home Valuation Report for This Property
The Home Valuation Report is an in-depth analysis detailing your home's value as well as a comparison with similar homes in the area
Purchase History
| Date | Buyer | Sale Price | Title Company |
|---|---|---|---|
| Kasowski Steven | -- | -- | |
| Deutsche Bank National Trust Co | -- | -- | |
| Silvernagel Jerome | -- | -- | |
| Gudmunson Sheldon L | -- | -- |
Source: Public Records
Mortgage History
| Date | Status | Borrower | Loan Amount |
|---|---|---|---|
| Previous Owner | Gudmunson Sheldon L | $420,000 |
Source: Public Records
Tax History
| Year | Tax Paid | Tax Assessment Tax Assessment Total Assessment is a certain percentage of the fair market value that is determined by local assessors to be the total taxable value of land and additions on the property. | Land | Improvement |
|---|---|---|---|---|
| 2024 | $9,436 | $352,300 | $58,950 | $293,350 |
| 2023 | $8,146 | $308,450 | $58,950 | $249,500 |
| 2022 | $6,926 | $283,500 | $58,950 | $224,550 |
| 2021 | $6,541 | $266,000 | $52,400 | $213,600 |
| 2020 | $6,298 | $263,400 | $52,400 | $211,000 |
| 2019 | $6,234 | $263,400 | $52,400 | $211,000 |
| 2018 | $6,262 | $261,300 | $52,400 | $208,900 |
| 2017 | $9,727 | $258,250 | $52,400 | $205,850 |
| 2016 | $7,582 | $257,400 | $25,050 | $232,350 |
| 2015 | $6,968 | $238,350 | $23,200 | $215,150 |
| 2014 | $6,450 | $201,700 | $21,100 | $180,600 |
| 2013 | $6,517 | $201,700 | $21,100 | $180,600 |
Source: Public Records
Map
Nearby Homes
- 915 Maple River Ct
- 911 Maple River Ct
- 919 Sunset Dr
- 909 Maple River Ct
- 907 Maple River Ct
- 431 Audrey Dr
- 912 Sunset Dr
- 918 Sunset Dr
- 916 Sunset Dr
- 920 Sunset Dr
- 914 Sunset Dr
- 504 Ashley Blvd
- 910 Sunset Dr
- 502 Ashley Blvd
- 429 Audrey Dr
- 500 Ashley Blvd
- 908 Sunset Dr
- 906 Sunset Dr
- 427 Audrey Dr
- 904 Sunset Dr
Your Personal Tour Guide
Ask me questions while you tour the home.