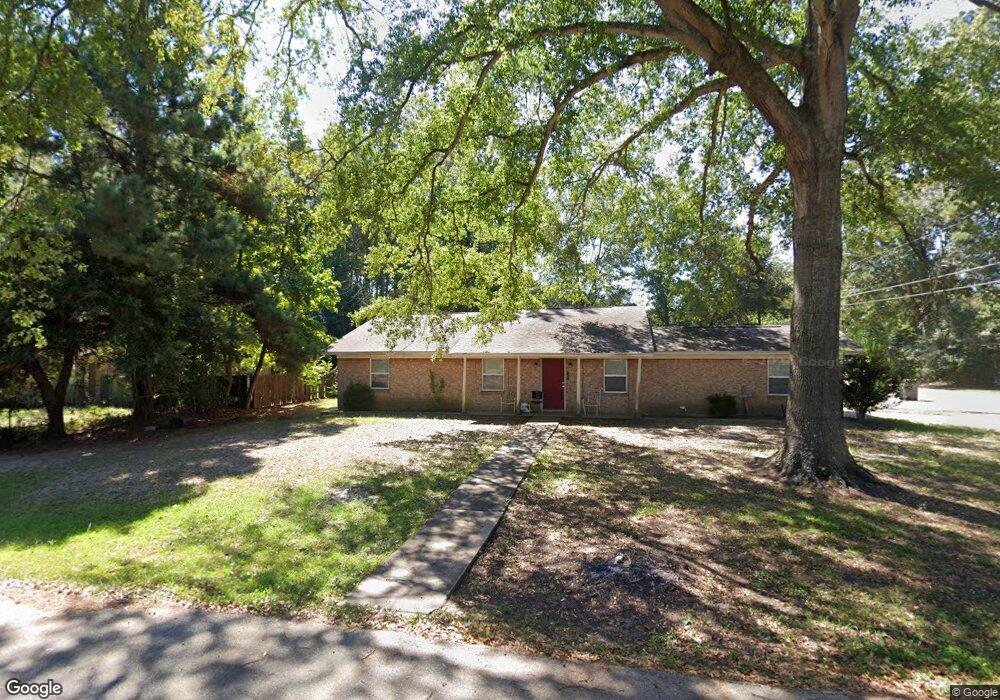
913 Mark St Lufkin, TX 75904
Estimated Value: $127,264 - $239,000
3
Beds
2
Baths
1,408
Sq Ft
$127/Sq Ft
Est. Value
About This Home
This home is located at 913 Mark St, Lufkin, TX 75904 and is currently estimated at $179,066, approximately $127 per square foot. 913 Mark St is a home located in Angelina County with nearby schools including Trout Primary School, Brookhollow Elementary School, and Lufkin Middle School.
Ownership History
Date
Name
Owned For
Owner Type
Purchase Details
Closed on
Sep 15, 2015
Sold by
Patel Prashant R and Teczely Ivett
Bought by
Sapcon Investments Llc 913 Mark Series
Current Estimated Value
Purchase Details
Closed on
Nov 3, 2011
Sold by
State Finanical Services Springleaf Inc
Bought by
Patel Prashant R
Purchase Details
Closed on
Oct 1, 2011
Sold by
Reynolds Carolyn
Bought by
American General Financial Services Inc
Create a Home Valuation Report for This Property
The Home Valuation Report is an in-depth analysis detailing your home's value as well as a comparison with similar homes in the area
Purchase History
| Date | Buyer | Sale Price | Title Company |
|---|---|---|---|
| Sapcon Investments Llc 913 Mark Series | -- | None Available | |
| Patel Prashant R | -- | None Available | |
| American General Financial Services Inc | $43,273 | None Available |
Source: Public Records
Tax History
| Year | Tax Paid | Tax Assessment Tax Assessment Total Assessment is a certain percentage of the fair market value that is determined by local assessors to be the total taxable value of land and additions on the property. | Land | Improvement |
|---|---|---|---|---|
| 2025 | $1,718 | $82,210 | $13,470 | $68,740 |
| 2024 | $1,679 | $80,360 | $13,470 | $66,890 |
| 2023 | $1,572 | $79,130 | $13,470 | $65,660 |
| 2022 | $1,729 | $75,900 | $6,650 | $69,250 |
| 2021 | $1,492 | $60,550 | $6,650 | $53,900 |
| 2020 | $1,274 | $51,840 | $6,650 | $45,190 |
| 2019 | $1,347 | $51,840 | $6,650 | $45,190 |
| 2018 | $1,488 | $64,730 | $6,650 | $58,080 |
| 2017 | $1,488 | $62,410 | $6,650 | $55,760 |
| 2016 | $1,451 | $60,860 | $6,650 | $54,210 |
| 2015 | -- | $60,860 | $6,650 | $54,210 |
| 2014 | -- | $60,560 | $6,650 | $53,910 |
Source: Public Records
Map
Nearby Homes
- 1435 Feagin Dr
- 1308 Southwood Dr
- 1008 Tom Temple Dr
- 1207 Southwood Dr
- 715 Pine Tree Ln
- 603 Morrow Ave
- 900 Wildbriar Dr
- 911 Evans Dr
- 417 Vine Dr
- 420 Vine Dr
- 409 Lynn Ave
- 915 Evans Dr
- 201 Mott Dr
- 214 Brooks St
- 909 Covington Dr
- 404 Dogwood Trail
- 907 Southwood Dr
- 1370 Evans-Gann Rd
- 01 Lane Dr
- 1202 Mimosa St
Your Personal Tour Guide
Ask me questions while you tour the home.