Estimated Value: $313,498 - $415,000
3
Beds
2
Baths
1,750
Sq Ft
$204/Sq Ft
Est. Value
About This Home
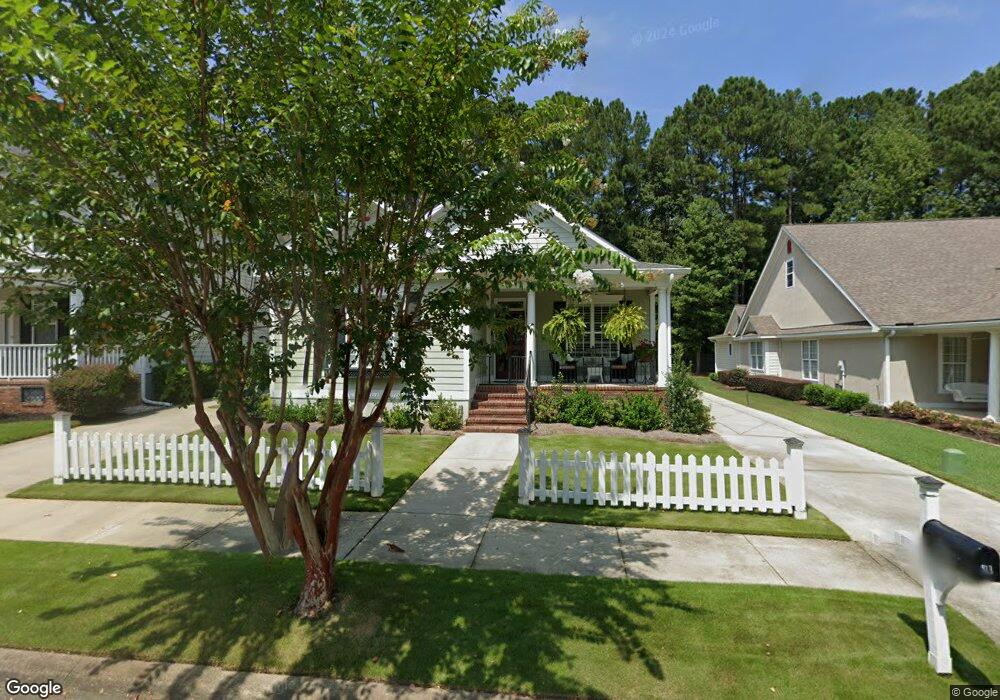
This home is located at 913 Mitchell Ln, Evans, GA 30809 and is currently estimated at $356,875, approximately $203 per square foot. 913 Mitchell Ln is a home located in Columbia County with nearby schools including Greenbrier Elementary School, Greenbrier Middle School, and Greenbrier High School.
Ownership History
Date
Name
Owned For
Owner Type
Purchase Details
Closed on
Mar 2, 2022
Sold by
Ellison Lottie R
Bought by
Starnes Cynthia Ellison and Starnes Russell Brakefield
Current Estimated Value
Purchase Details
Closed on
Jan 21, 2016
Sold by
Carson Robert W
Bought by
Ellison Lottie R
Purchase Details
Closed on
Oct 18, 2013
Sold by
Pdh Bldrs Inc
Bought by
Wilder Jonathan T
Purchase Details
Closed on
Mar 11, 2005
Sold by
Herbert Lori Emmott and Herbert Christopher J
Bought by
Carson Robert W and Carson Angelia H
Purchase Details
Closed on
Sep 30, 2003
Sold by
M Homebuilders Inc
Bought by
Herbert Christopher J and Herbert Lori Emmott
Home Financials for this Owner
Home Financials are based on the most recent Mortgage that was taken out on this home.
Original Mortgage
$149,950
Interest Rate
5%
Mortgage Type
Purchase Money Mortgage
Create a Home Valuation Report for This Property
The Home Valuation Report is an in-depth analysis detailing your home's value as well as a comparison with similar homes in the area
Home Values in the Area
Average Home Value in this Area
Purchase History
| Date | Buyer | Sale Price | Title Company |
|---|---|---|---|
| Starnes Cynthia Ellison | $180,000 | -- | |
| Ellison Lottie R | $180,000 | -- | |
| Wilder Jonathan T | $339,900 | -- | |
| Carson Robert W | $217,900 | -- | |
| Herbert Christopher J | $187,500 | -- |
Source: Public Records
Mortgage History
| Date | Status | Borrower | Loan Amount |
|---|---|---|---|
| Previous Owner | Herbert Christopher J | $149,950 |
Source: Public Records
Tax History
| Year | Tax Paid | Tax Assessment Tax Assessment Total Assessment is a certain percentage of the fair market value that is determined by local assessors to be the total taxable value of land and additions on the property. | Land | Improvement |
|---|---|---|---|---|
| 2025 | $3,396 | $139,950 | $32,504 | $107,446 |
| 2024 | $3,399 | $133,690 | $30,604 | $103,086 |
| 2023 | $3,399 | $133,667 | $30,504 | $103,163 |
| 2022 | $2,901 | $109,415 | $25,804 | $83,611 |
| 2021 | $2,844 | $102,478 | $23,704 | $78,774 |
| 2020 | $2,875 | $101,448 | $23,804 | $77,644 |
| 2019 | $2,668 | $93,988 | $24,204 | $69,784 |
| 2018 | $2,535 | $88,910 | $22,104 | $66,806 |
| 2017 | $2,071 | $72,000 | $21,204 | $50,796 |
| 2016 | $2,259 | $83,626 | $20,380 | $63,246 |
| 2015 | $2,274 | $84,040 | $20,280 | $63,760 |
| 2014 | $2,135 | $77,924 | $18,480 | $59,444 |
Source: Public Records
Map
Nearby Homes
- 960 Mitchell Ln
- 129 Pond View Rd
- 2303 Amberley Pass
- 2402 Amberley Dr
- 1005 Mitchell Ln
- 462 Armstrong Way
- 422 Armstrong Way
- 305 Buxton Ln
- 1037 Spotswood Cir
- 230 Callahan Dr
- 1023 Spotswood Cir
- 510 Jutland Way
- 4076 Dewaal St
- 520 Jutland Way
- 1009 Spotswood Cir
- 4025 Dewaal St
- 1007 Spotswood Cir
- 4027 Dewaal St
- 2034 Summerton Cir
- 971 Windmill Ln
- 915 Mitchell Ln
- 911 Mitchell Ln
- 917 Mitchell Ln
- 919 Mitchell Ln
- 914 Mitchell Ln
- 921 Mitchell Ln
- 602 Cavanaugh Way
- 604 Cavanaugh Way
- 101 Pond View Rd
- 606 Cavanaugh Way
- 901 Mitchell Ln
- 925 Mitchell Ln
- 103 Pond View Rd
- 608 Cavanaugh Way
- 378 Sandleton Way
- 370 Sandleton Way
- 927 Mitchell Ln
- 610 Cavanaugh Way
- 368 Sandleton Way
- 380 Sandleton Way
Your Personal Tour Guide
Ask me questions while you tour the home.