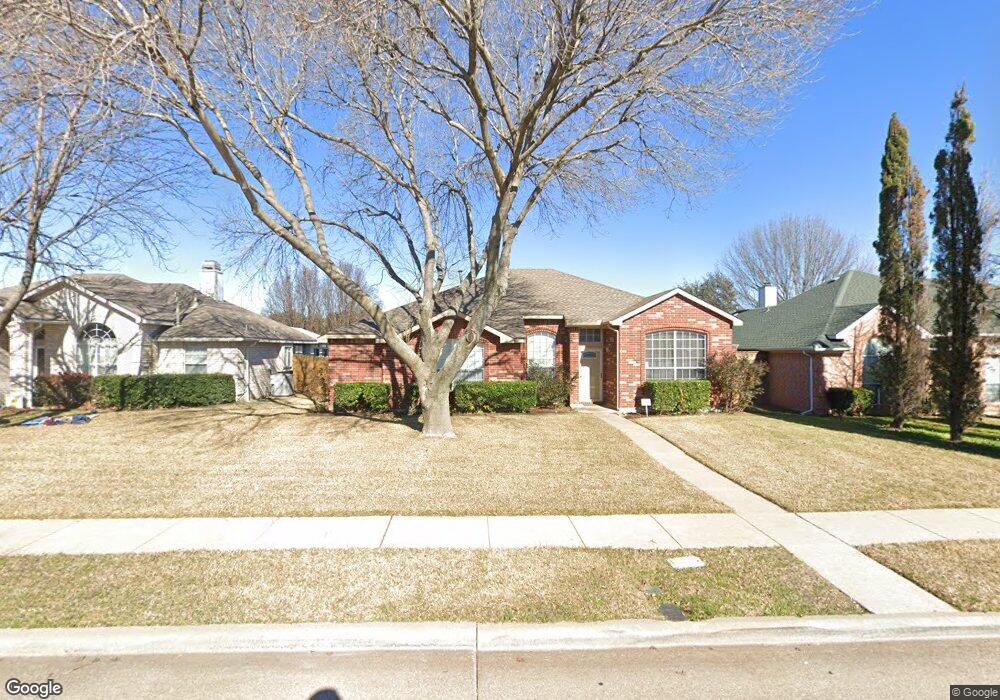
913 Moore St Cedar Hill, TX 75104
Estimated Value: $270,000 - $303,000
3
Beds
2
Baths
1,758
Sq Ft
$164/Sq Ft
Est. Value
About This Home
This home is located at 913 Moore St, Cedar Hill, TX 75104 and is currently estimated at $288,880, approximately $164 per square foot. 913 Moore St is a home located in Dallas County with nearby schools including Waterford Oaks Elementary School, Bessie Coleman Middle School, and Cedar Hill High School.
Ownership History
Date
Name
Owned For
Owner Type
Purchase Details
Closed on
Apr 27, 1994
Sold by
Johnson Sandra Delores
Bought by
Roberts Sharon Gwendolyn
Current Estimated Value
Home Financials for this Owner
Home Financials are based on the most recent Mortgage that was taken out on this home.
Original Mortgage
$79,806
Interest Rate
7.71%
Mortgage Type
FHA
Purchase Details
Closed on
Oct 25, 1993
Sold by
Johnson Andrew
Bought by
Johnson Sandra D
Create a Home Valuation Report for This Property
The Home Valuation Report is an in-depth analysis detailing your home's value as well as a comparison with similar homes in the area
Purchase History
| Date | Buyer | Sale Price | Title Company |
|---|---|---|---|
| Roberts Sharon Gwendolyn | -- | -- | |
| Johnson Sandra D | -- | -- |
Source: Public Records
Mortgage History
| Date | Status | Borrower | Loan Amount |
|---|---|---|---|
| Closed | Roberts Sharon Gwendolyn | $79,806 |
Source: Public Records
Tax History
| Year | Tax Paid | Tax Assessment Tax Assessment Total Assessment is a certain percentage of the fair market value that is determined by local assessors to be the total taxable value of land and additions on the property. | Land | Improvement |
|---|---|---|---|---|
| 2025 | $4,002 | $310,880 | $60,000 | $250,880 |
| 2024 | $4,002 | $310,880 | $60,000 | $250,880 |
| 2023 | $4,002 | $212,860 | $55,000 | $157,860 |
| 2022 | $4,196 | $212,860 | $0 | $0 |
| 2021 | $4,689 | $183,750 | $40,000 | $143,750 |
| 2020 | $4,779 | $183,020 | $30,000 | $153,020 |
| 2019 | $4,996 | $183,020 | $30,000 | $153,020 |
| 2018 | $5,255 | $183,020 | $30,000 | $153,020 |
| 2017 | $4,110 | $143,230 | $23,000 | $120,230 |
| 2016 | $4,110 | $143,230 | $23,000 | $120,230 |
| 2015 | $2,948 | $143,470 | $23,000 | $120,470 |
| 2014 | $2,948 | $115,300 | $23,000 | $92,300 |
Source: Public Records
Map
Nearby Homes
- 614 Pondview Dr
- 611 Pondview Dr
- 630 Bluechalk Dr
- 805 Bray St
- 768 Lovern St
- 123 Chamblin Dr
- 814 Nafus St
- 517 E Belt Line Rd
- 1071 Streamside Dr
- 1088 Magnolia Ln
- 1101 N J Elmer Weaver Fwy
- 727 E Pleasant Run Rd
- 1213 Calvert Dr
- 956 N Highway 67
- 945 Penrose Dr
- 937 Penrose Dr
- 804 Pourtales Ln
- 845 Pourtales Ln
- 808 Pourtales Ln
- 432 E Belt Line Rd
Your Personal Tour Guide
Ask me questions while you tour the home.