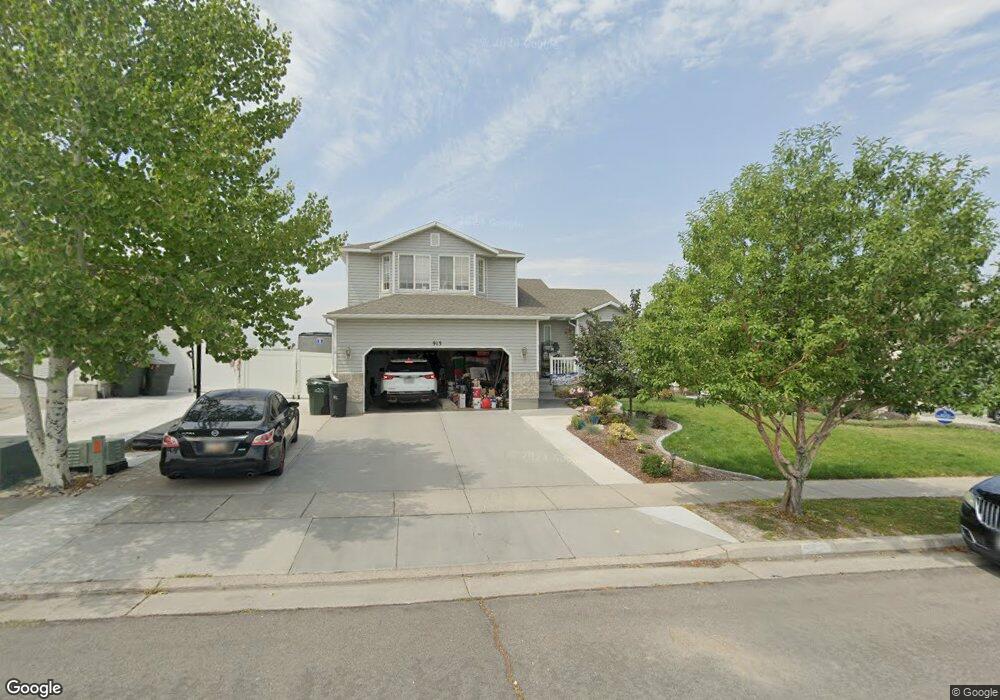
913 N 720 W Tooele, UT 84074
Estimated Value: $456,000 - $479,366
5
Beds
4
Baths
2,793
Sq Ft
$169/Sq Ft
Est. Value
About This Home
This home is located at 913 N 720 W, Tooele, UT 84074 and is currently estimated at $470,842, approximately $168 per square foot. 913 N 720 W is a home located in Tooele County with nearby schools including Northlake Elementary School, Tooele Junior High School, and Tooele High School.
Ownership History
Date
Name
Owned For
Owner Type
Purchase Details
Closed on
Nov 12, 2021
Sold by
Pilling Matthew K and Pilling Mishala A
Bought by
Pilling Matthew and Pilling Mishala
Current Estimated Value
Home Financials for this Owner
Home Financials are based on the most recent Mortgage that was taken out on this home.
Original Mortgage
$305,250
Interest Rate
2.99%
Mortgage Type
FHA
Purchase Details
Closed on
Sep 6, 2011
Sold by
Hoopes Randy
Bought by
Hoopes Randy and Hoopes Patricia Ann
Home Financials for this Owner
Home Financials are based on the most recent Mortgage that was taken out on this home.
Original Mortgage
$192,910
Interest Rate
4.4%
Mortgage Type
FHA
Create a Home Valuation Report for This Property
The Home Valuation Report is an in-depth analysis detailing your home's value as well as a comparison with similar homes in the area
Home Values in the Area
Average Home Value in this Area
Purchase History
| Date | Buyer | Sale Price | Title Company |
|---|---|---|---|
| Pilling Matthew | -- | First American Title Ins Co | |
| Hoopes Randy | -- | Cottonwood Title Insurance A |
Source: Public Records
Mortgage History
| Date | Status | Borrower | Loan Amount |
|---|---|---|---|
| Closed | Pilling Matthew | $305,250 | |
| Closed | Hoopes Randy | $192,910 |
Source: Public Records
Tax History Compared to Growth
Tax History
| Year | Tax Paid | Tax Assessment Tax Assessment Total Assessment is a certain percentage of the fair market value that is determined by local assessors to be the total taxable value of land and additions on the property. | Land | Improvement |
|---|---|---|---|---|
| 2025 | $3,076 | $466,487 | $100,000 | $366,487 |
| 2024 | $3,372 | $257,362 | $55,000 | $202,362 |
| 2023 | $3,372 | $242,104 | $52,383 | $189,721 |
| 2022 | $3,157 | $271,620 | $66,110 | $205,510 |
| 2021 | $2,523 | $181,544 | $20,763 | $160,781 |
| 2020 | $2,393 | $298,758 | $37,750 | $261,008 |
| 2019 | $2,332 | $286,329 | $37,750 | $248,579 |
| 2018 | $2,110 | $245,660 | $35,000 | $210,660 |
| 2017 | $1,705 | $235,629 | $35,000 | $200,629 |
| 2016 | $1,367 | $113,592 | $13,750 | $99,842 |
| 2015 | $1,367 | $99,394 | $0 | $0 |
| 2014 | -- | $93,646 | $0 | $0 |
Source: Public Records
Map
Nearby Homes
- 792 N 630 W
- 831 Gleneagle Ct
- 1151 N 680 W Unit 8
- 1177 N 680 W Unit 3
- 1176 N 620 W Unit 221
- 606 W Caroles Way Unit 12
- 602 W Caroles Way Unit 13
- 515 W Caroles Way Unit 123
- 643 W 1360 N Unit 223
- 454 W 2520 N
- 1096 N 340 W
- 459 W Sapphire Dr Unit 7034
- 412 W Sapphire Dr Unit 7009
- 541 N Coleman St
- 429 W Sapphire Dr Unit 7038
- 552 W 1410 N
- 409 W Sapphire Dr Unit 7040
- 366 W Diamant Ln
- 422 W 1360 N
- 578 W 1470 N Unit 22