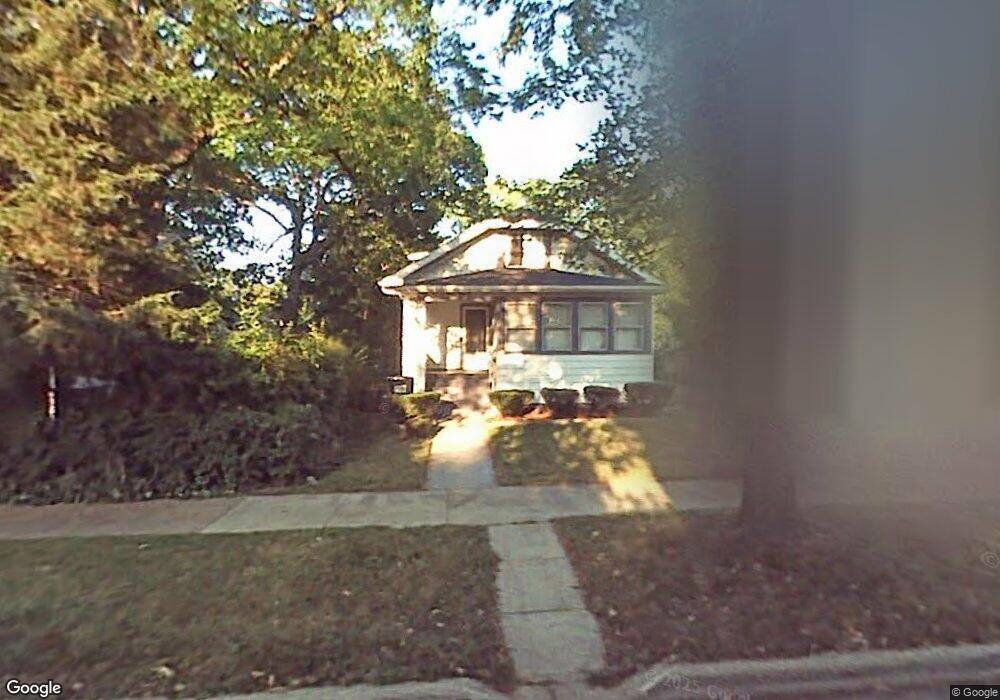
913 N Ash St Waukegan, IL 60085
Estimated Value: $210,000 - $267,000
3
Beds
1
Bath
1,723
Sq Ft
$137/Sq Ft
Est. Value
About This Home
This home is located at 913 N Ash St, Waukegan, IL 60085 and is currently estimated at $235,504, approximately $136 per square foot. 913 N Ash St is a home located in Lake County with nearby schools including Glen Flora Elementary School, Edith M Smith Middle School, and Waukegan High School.
Ownership History
Date
Name
Owned For
Owner Type
Purchase Details
Closed on
Mar 24, 1998
Sold by
Byerly Darrell D
Bought by
Luna Paul A and Gaughran Jennifer M
Current Estimated Value
Home Financials for this Owner
Home Financials are based on the most recent Mortgage that was taken out on this home.
Original Mortgage
$92,350
Outstanding Balance
$16,999
Interest Rate
7.09%
Mortgage Type
FHA
Estimated Equity
$218,505
Create a Home Valuation Report for This Property
The Home Valuation Report is an in-depth analysis detailing your home's value as well as a comparison with similar homes in the area
Home Values in the Area
Average Home Value in this Area
Purchase History
| Date | Buyer | Sale Price | Title Company |
|---|---|---|---|
| Luna Paul A | $93,000 | -- |
Source: Public Records
Mortgage History
| Date | Status | Borrower | Loan Amount |
|---|---|---|---|
| Open | Luna Paul A | $92,350 |
Source: Public Records
Tax History Compared to Growth
Tax History
| Year | Tax Paid | Tax Assessment Tax Assessment Total Assessment is a certain percentage of the fair market value that is determined by local assessors to be the total taxable value of land and additions on the property. | Land | Improvement |
|---|---|---|---|---|
| 2024 | $5,252 | $61,804 | $6,983 | $54,821 |
| 2023 | $4,330 | $55,693 | $6,252 | $49,441 |
| 2022 | $4,330 | $50,292 | $5,946 | $44,346 |
| 2021 | $3,893 | $43,345 | $5,305 | $38,040 |
| 2020 | $3,897 | $40,381 | $4,942 | $35,439 |
| 2019 | $3,870 | $37,003 | $4,529 | $32,474 |
| 2018 | $3,724 | $35,184 | $5,769 | $29,415 |
| 2017 | $3,574 | $31,128 | $5,104 | $26,024 |
| 2016 | $3,253 | $27,049 | $4,435 | $22,614 |
| 2015 | $3,076 | $24,209 | $3,969 | $20,240 |
| 2014 | $2,707 | $21,541 | $3,885 | $17,656 |
| 2012 | $3,575 | $23,337 | $4,209 | $19,128 |
Source: Public Records
Map
Nearby Homes
- 918 N Ash St
- 1110 N Ash St
- 415 W Ridgeland Ave
- 1122 N Ash St
- 620 N Poplar St
- 702 Franklin St
- 917 N Linden Ave
- 325 4th St
- 522 N Poplar St
- 723 N County St
- 1109 Massena Ave
- 217 Stewart Ave
- 511 Chestnut St
- 1336 N Ash St
- 1335 Chestnut St
- 428 N Poplar St
- 452 North Ave
- 1105 Woodlawn Cir
- 1000 Pine St
- 611 N Genesee St