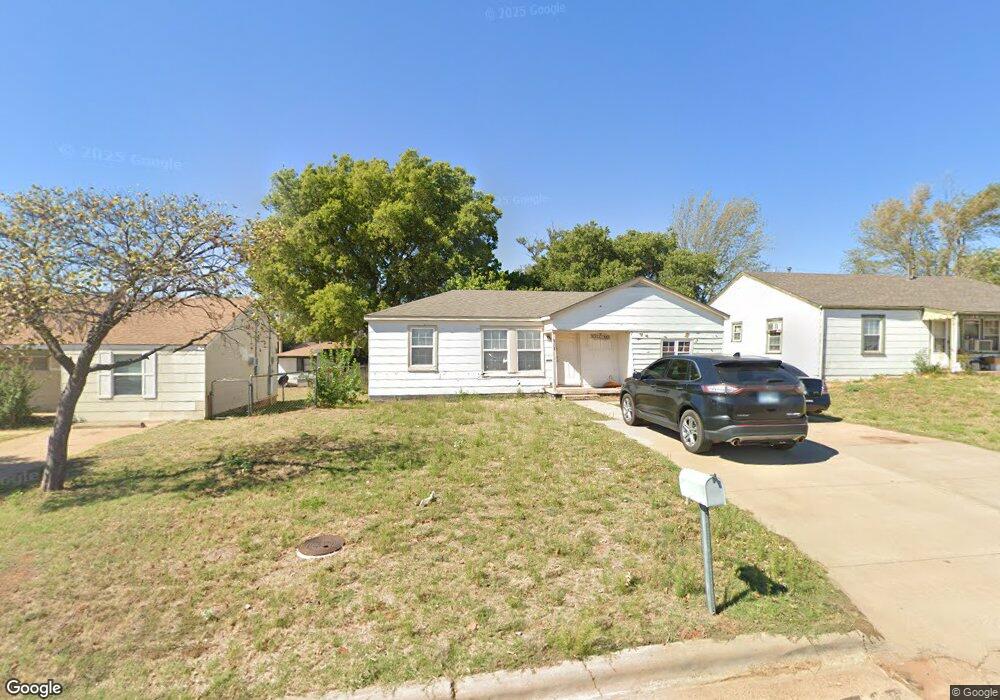
913 N Indiana St Weatherford, OK 73096
Estimated Value: $104,955 - $142,000
2
Beds
1
Bath
1,016
Sq Ft
$120/Sq Ft
Est. Value
About This Home
This home is located at 913 N Indiana St, Weatherford, OK 73096 and is currently estimated at $121,989, approximately $120 per square foot. 913 N Indiana St is a home located in Custer County with nearby schools including Burcham Elementary School, Lt. General Thomas P. Stafford Elementary School, and Weatherford West Elementary School.
Ownership History
Date
Name
Owned For
Owner Type
Purchase Details
Closed on
Nov 17, 2023
Sold by
Hart Sell Inc
Bought by
Calzada David G and Falcon Natali A
Current Estimated Value
Home Financials for this Owner
Home Financials are based on the most recent Mortgage that was taken out on this home.
Original Mortgage
$67,245
Outstanding Balance
$61,917
Interest Rate
6.7%
Mortgage Type
Construction
Estimated Equity
$60,072
Purchase Details
Closed on
Jan 17, 2013
Sold by
Hartsell Judy A
Bought by
Hart Sell Inc
Purchase Details
Closed on
Dec 22, 2003
Sold by
Hartsell Inc
Bought by
Russell R Hartsell
Purchase Details
Closed on
Jun 23, 2003
Sold by
Doris E Johnson Etvir
Bought by
Hart Sell Inc
Purchase Details
Closed on
Feb 9, 1996
Sold by
Callie Strong Waldrop
Bought by
Doris E Johnson
Purchase Details
Closed on
Feb 28, 1995
Sold by
Curtis Strong
Bought by
Callie Strong Waldrop
Create a Home Valuation Report for This Property
The Home Valuation Report is an in-depth analysis detailing your home's value as well as a comparison with similar homes in the area
Home Values in the Area
Average Home Value in this Area
Purchase History
| Date | Buyer | Sale Price | Title Company |
|---|---|---|---|
| Calzada David G | $80,000 | Ort | |
| Hart Sell Inc | -- | -- | |
| Hartsell Judy A | -- | -- | |
| Russell R Hartsell | -- | -- | |
| Hart Sell Inc | $8,500 | -- | |
| Doris E Johnson | $15,000 | -- | |
| Callie Strong Waldrop | -- | -- |
Source: Public Records
Mortgage History
| Date | Status | Borrower | Loan Amount |
|---|---|---|---|
| Open | Calzada David G | $67,245 |
Source: Public Records
Tax History Compared to Growth
Tax History
| Year | Tax Paid | Tax Assessment Tax Assessment Total Assessment is a certain percentage of the fair market value that is determined by local assessors to be the total taxable value of land and additions on the property. | Land | Improvement |
|---|---|---|---|---|
| 2025 | $868 | $5,818 | $924 | $4,894 |
| 2024 | $868 | $8,800 | $924 | $7,876 |
| 2023 | $868 | $5,955 | $784 | $5,171 |
| 2022 | $546 | $5,671 | $755 | $4,916 |
| 2021 | $523 | $5,402 | $728 | $4,674 |
| 2020 | $518 | $5,144 | $702 | $4,442 |
| 2019 | $499 | $4,900 | $674 | $4,226 |
| 2018 | $432 | $4,666 | $642 | $4,024 |
| 2017 | $419 | $4,444 | $582 | $3,862 |
| 2016 | $403 | $4,233 | $554 | $3,679 |
| 2015 | $389 | $4,030 | $513 | $3,517 |
| 2014 | $370 | $3,839 | $489 | $3,350 |
Source: Public Records
Map
Nearby Homes
- 1106 N Indiana St
- 1208 N Indiana St
- 315 E Huber Ave
- 1207 N Illinois St
- 1212 N Illinois St
- 3305 Hogan Dr
- 3301 Hogan Dr
- 3509 Hogan Dr
- 3513 Hogan Dr
- 1229 N Indiana St
- 1230 N Indiana St
- 1025 Gartrell Place
- 0 E Arapaho Ave
- 10 E Arapaho Ave
- 09 E Arapaho Ave
- 08 E Arapaho Ave
- 07 E Arapaho Ave
- 06 E Arapaho Ave
- 05 E Arapaho Ave
- 04 E Arapaho Ave
- 907 N Indiana St
- 919 N Indiana St
- 923 N Indiana St
- 901 N Indiana St
- 912 N Caddo St
- 918 N Caddo St
- 906 N Caddo St
- 902 N Caddo St
- 409 E Oklahoma Ave
- 1001 N Indiana St
- 415 E Oklahoma Ave
- 821 N Indiana St
- 1002 N Caddo St
- 824 N Caddo St
- 1002 N Indiana St
- 1006 N Caddo St
- 820 N Indiana St
- 816 N Caddo St
- 923 N Caddo St
- 1010 N Caddo St