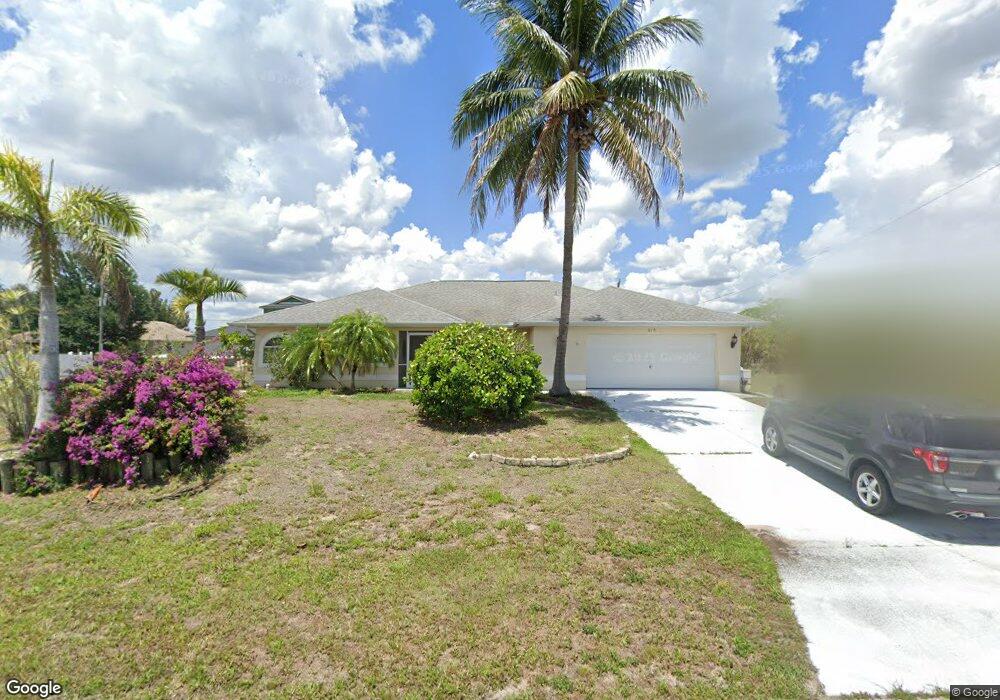
913 NE 17th St Unit 32 Cape Coral, FL 33909
Diplomat NeighborhoodEstimated Value: $333,206 - $402,000
3
Beds
2
Baths
2,919
Sq Ft
$126/Sq Ft
Est. Value
About This Home
This home is located at 913 NE 17th St Unit 32, Cape Coral, FL 33909 and is currently estimated at $367,552, approximately $125 per square foot. 913 NE 17th St Unit 32 is a home located in Lee County with nearby schools including Dr. Carrie D. Robinson Littleton Elementary School, Caloosa Elementary School, and Tropic Isles Elementary School.
Ownership History
Date
Name
Owned For
Owner Type
Purchase Details
Closed on
Feb 7, 2011
Sold by
Federal Home Loan Mortgage Corporation
Bought by
Day Steven E
Current Estimated Value
Purchase Details
Closed on
Oct 5, 2010
Sold by
Chase Home Finance Llc
Bought by
Federal Home Loan Mortgage Corp
Purchase Details
Closed on
Sep 8, 2010
Sold by
Faux Jerome
Bought by
Chase Home Finance Llc
Purchase Details
Closed on
Jul 28, 2004
Sold by
Thieret Dale and Thieret Kim
Bought by
Faux Jerome W and Faux Carole A
Home Financials for this Owner
Home Financials are based on the most recent Mortgage that was taken out on this home.
Original Mortgage
$208,900
Interest Rate
6.24%
Mortgage Type
Unknown
Purchase Details
Closed on
Dec 2, 1997
Sold by
Meunier Marcel L and Meunier Marion
Bought by
Thieret Dale and Thieret Kim
Create a Home Valuation Report for This Property
The Home Valuation Report is an in-depth analysis detailing your home's value as well as a comparison with similar homes in the area
Home Values in the Area
Average Home Value in this Area
Purchase History
| Date | Buyer | Sale Price | Title Company |
|---|---|---|---|
| Day Steven E | $104,000 | Attorney | |
| Federal Home Loan Mortgage Corp | -- | Attorney | |
| Chase Home Finance Llc | $87,500 | None Available | |
| Faux Jerome W | $219,900 | Title Professionals Of Fl | |
| Thieret Dale | $1,900 | -- |
Source: Public Records
Mortgage History
| Date | Status | Borrower | Loan Amount |
|---|---|---|---|
| Previous Owner | Faux Jerome W | $208,900 |
Source: Public Records
Tax History Compared to Growth
Tax History
| Year | Tax Paid | Tax Assessment Tax Assessment Total Assessment is a certain percentage of the fair market value that is determined by local assessors to be the total taxable value of land and additions on the property. | Land | Improvement |
|---|---|---|---|---|
| 2025 | $5,605 | $319,306 | -- | -- |
| 2024 | $5,337 | $290,278 | -- | -- |
| 2023 | $5,337 | $263,889 | $0 | $0 |
| 2022 | $4,942 | $239,899 | $0 | $0 |
| 2021 | $4,385 | $218,090 | $8,700 | $209,390 |
| 2020 | $4,275 | $204,289 | $8,600 | $195,689 |
| 2019 | $4,129 | $197,833 | $8,500 | $189,333 |
| 2018 | $4,252 | $200,266 | $11,000 | $189,266 |
| 2017 | $4,064 | $194,619 | $7,100 | $187,519 |
| 2016 | $3,733 | $174,245 | $7,100 | $167,145 |
| 2015 | $3,471 | $155,405 | $6,500 | $148,905 |
| 2014 | $3,293 | $151,195 | $5,922 | $145,273 |
| 2013 | -- | $133,209 | $5,300 | $127,909 |
Source: Public Records
Map
Nearby Homes
- 923 NE 17th St
- 905 NE 17th St
- 1702 NE 10th Place
- 1013 NE 16th Terrace
- 1800 NE 10th Place
- 1815 NE 10th Ave
- 833 NE 15th Ln
- 1816 NE 8th Place
- 1813 Andalusia Blvd
- 825 NE 15th Ln
- 1903 NE 10th Ave
- 915 NE 19th St
- 821 NE 15th Ln
- 1626 Andalusia Blvd
- 832 NE 15th Ln
- 901 NE 15th Terrace
- 504 NE 16th Terrace
- 902 NE 16th Terrace
- 909 NE 17th St
- 912 NE 17th Terrace Unit 32
- 912 NE 17th Terrace
- 908 NE 17th Terrace
- 918 NE 17th Terrace
- 912 NE 17th St
- 908 NE 17th St
- 918 NE 17th St
- 904 NE 17th Terrace
- 922 NE 17th Terrace
- 901 NE 17th St
- 904 NE 17th St
- 922 NE 17th St
- 900 NE 17th Terrace
- 927 NE 17th St
- 900 NE 17th St
- 915 NE 16th Terrace
- 911 NE 17th Terrace
- 915 NE 17th Terrace
- 926 NE 17th Terrace