Estimated Value: $133,933 - $227,000
1
Bed
1
Bath
576
Sq Ft
$285/Sq Ft
Est. Value
About This Home
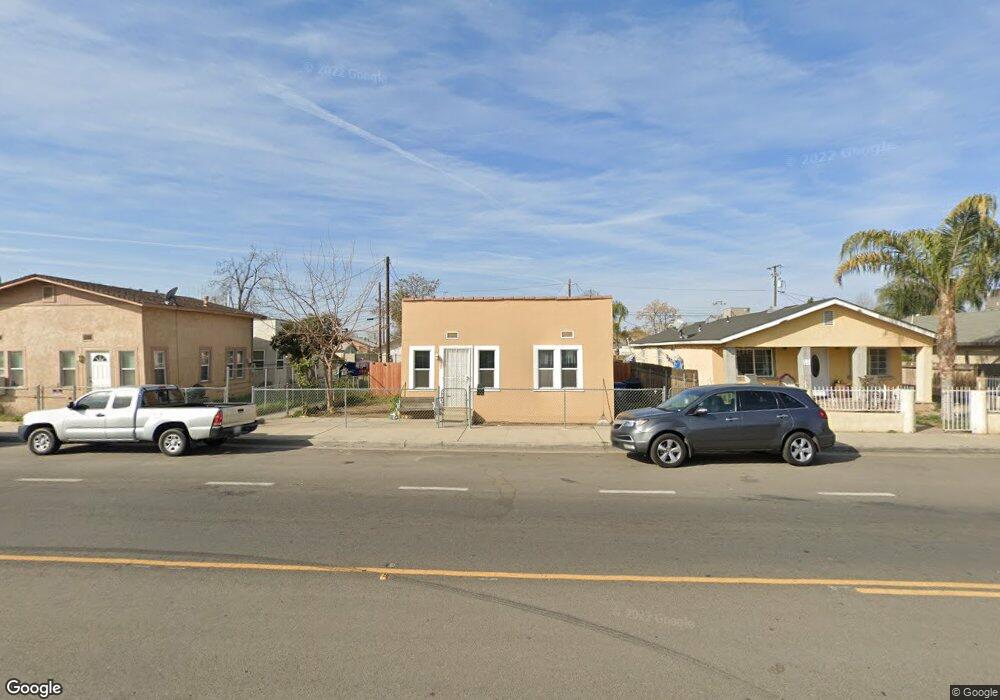
This home is located at 913 P St, Bakersfield, CA 93304 and is currently estimated at $164,233, approximately $285 per square foot. 913 P St is a home located in Kern County with nearby schools including McKinley Elementary School, Emerson Middle School, and Bakersfield High School.
Ownership History
Date
Name
Owned For
Owner Type
Purchase Details
Closed on
Jul 24, 2025
Sold by
Goedhart Brandon William
Bought by
Goedhart Brandon William and Goedhart Samantha Marie
Current Estimated Value
Home Financials for this Owner
Home Financials are based on the most recent Mortgage that was taken out on this home.
Original Mortgage
$97,500
Outstanding Balance
$96,826
Interest Rate
5.97%
Mortgage Type
New Conventional
Estimated Equity
$67,407
Purchase Details
Closed on
Oct 3, 2024
Sold by
Goedhart Samantha
Bought by
Goedhart Brandon William
Purchase Details
Closed on
Apr 4, 2018
Sold by
Jimenez Severiano
Bought by
Wu James Y
Create a Home Valuation Report for This Property
The Home Valuation Report is an in-depth analysis detailing your home's value as well as a comparison with similar homes in the area
Home Values in the Area
Average Home Value in this Area
Purchase History
| Date | Buyer | Sale Price | Title Company |
|---|---|---|---|
| Goedhart Brandon William | -- | Stewart Title Of California | |
| Goedhart Brandon William | -- | Stewart Title | |
| Goedhart Brandon William | $50,000 | Stewart Title Of California | |
| Wu James Y | $14,400 | None Available |
Source: Public Records
Mortgage History
| Date | Status | Borrower | Loan Amount |
|---|---|---|---|
| Open | Goedhart Brandon William | $97,500 |
Source: Public Records
Tax History
| Year | Tax Paid | Tax Assessment Tax Assessment Total Assessment is a certain percentage of the fair market value that is determined by local assessors to be the total taxable value of land and additions on the property. | Land | Improvement |
|---|---|---|---|---|
| 2025 | $1,222 | $105,000 | $18,000 | $87,000 |
| 2024 | $1,222 | $43,743 | $16,403 | $27,340 |
| 2023 | $1,189 | $42,886 | $16,082 | $26,804 |
| 2022 | $1,146 | $42,046 | $15,767 | $26,279 |
| 2021 | $1,050 | $41,222 | $15,458 | $25,764 |
| 2020 | $1,016 | $40,800 | $15,300 | $25,500 |
| 2019 | $1,002 | $41,181 | $15,836 | $25,345 |
| 2018 | $983 | $39,584 | $15,222 | $24,362 |
| 2017 | $2,516 | $38,809 | $14,924 | $23,885 |
| 2016 | $1,912 | $38,049 | $14,632 | $23,417 |
| 2015 | $910 | $37,479 | $14,413 | $23,066 |
| 2014 | $1,242 | $36,746 | $14,131 | $22,615 |
Source: Public Records
Map
Nearby Homes
Your Personal Tour Guide
Ask me questions while you tour the home.