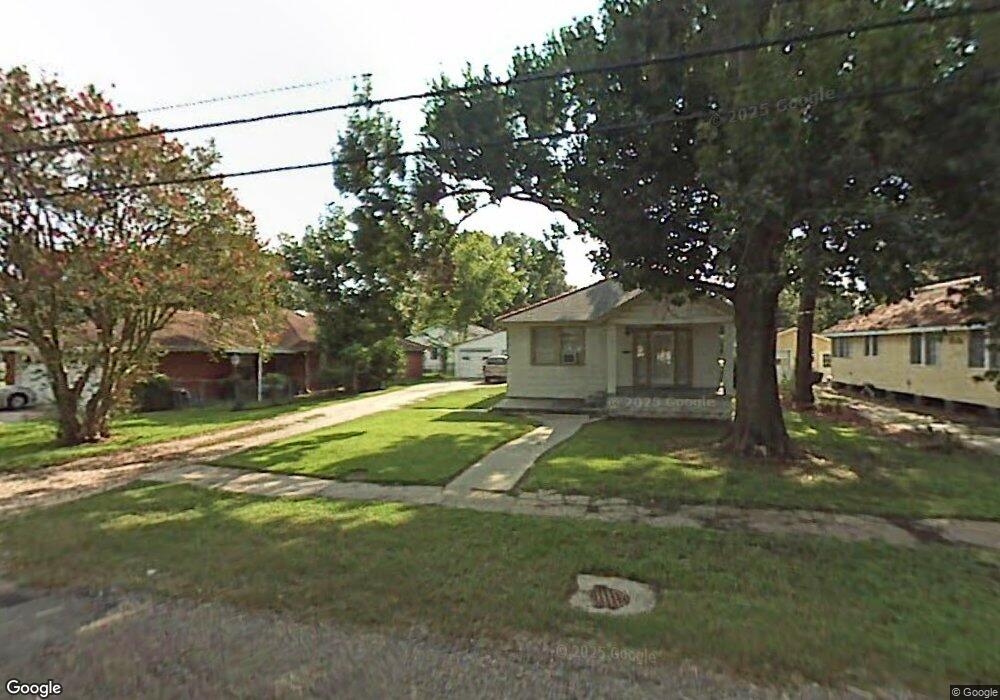
913 Ridgelake Dr Metairie, LA 70001
Old Metairie NeighborhoodEstimated Value: $435,000 - $498,000
2
Beds
1
Bath
1,076
Sq Ft
$433/Sq Ft
Est. Value
About This Home
This home is located at 913 Ridgelake Dr, Metairie, LA 70001 and is currently estimated at $465,667, approximately $432 per square foot. 913 Ridgelake Dr is a home located in Jefferson Parish with nearby schools including Ella Dolhonde Elementary School, Metairie Academy For Advanced Studies, and Riverdale High School.
Ownership History
Date
Name
Owned For
Owner Type
Purchase Details
Closed on
Oct 19, 2016
Sold by
Busenlener John R
Bought by
Busenlener Christy Gab and Busenlener Mark J
Current Estimated Value
Home Financials for this Owner
Home Financials are based on the most recent Mortgage that was taken out on this home.
Original Mortgage
$402,400
Outstanding Balance
$322,394
Interest Rate
3.44%
Mortgage Type
New Conventional
Estimated Equity
$143,273
Purchase Details
Closed on
Mar 14, 2015
Sold by
Busenlener Andrew R
Bought by
Busenlener John R
Purchase Details
Closed on
Dec 2, 2005
Sold by
Biggs Edward H
Bought by
Busenlener Andrew
Home Financials for this Owner
Home Financials are based on the most recent Mortgage that was taken out on this home.
Original Mortgage
$213,750
Interest Rate
6.12%
Mortgage Type
Purchase Money Mortgage
Create a Home Valuation Report for This Property
The Home Valuation Report is an in-depth analysis detailing your home's value as well as a comparison with similar homes in the area
Home Values in the Area
Average Home Value in this Area
Purchase History
| Date | Buyer | Sale Price | Title Company |
|---|---|---|---|
| Busenlener Christy Gab | $503,000 | Capital Title Agency Inc | |
| Busenlener John R | $104,000 | -- | |
| Busenlener Andrew | $225,000 | -- |
Source: Public Records
Mortgage History
| Date | Status | Borrower | Loan Amount |
|---|---|---|---|
| Open | Busenlener Christy Gab | $402,400 | |
| Previous Owner | Busenlener Andrew | $213,750 |
Source: Public Records
Tax History Compared to Growth
Tax History
| Year | Tax Paid | Tax Assessment Tax Assessment Total Assessment is a certain percentage of the fair market value that is determined by local assessors to be the total taxable value of land and additions on the property. | Land | Improvement |
|---|---|---|---|---|
| 2024 | $260 | $49,480 | $22,900 | $26,580 |
| 2023 | $5,424 | $48,730 | $18,320 | $30,410 |
| 2022 | $6,243 | $48,730 | $18,320 | $30,410 |
| 2021 | $5,798 | $48,730 | $18,320 | $30,410 |
| 2020 | $5,757 | $48,730 | $18,320 | $30,410 |
| 2019 | $5,804 | $47,790 | $14,660 | $33,130 |
| 2018 | $5,419 | $47,790 | $14,660 | $33,130 |
| 2017 | $5,419 | $47,790 | $14,660 | $33,130 |
| 2016 | $2,590 | $23,290 | $14,660 | $8,630 |
| 2015 | $1,725 | $22,840 | $12,460 | $10,380 |
| 2014 | $1,725 | $22,840 | $12,460 | $10,380 |
Source: Public Records
Map
Nearby Homes
- 921 Ridgelake Dr
- 909 Ridgelake Dr
- 3012 47th St
- 3008 47th St
- 3009 48th St
- 3013 48th St
- 1001 Ridgelake Dr
- 3013 47th St
- 914 Ridgelake Dr
- 1005 Ridgelake Dr
- 904 Ridgelake Dr
- Lot 12 & 13 Harlem Parkway St
- 900 Ridgelake Dr
- 1000 Ridgelake Dr
- 3005 48th St
- 3009 47th St
- 817 Ridgelake Dr
- 1009 Ridgelake Dr
- 1006 Ridgelake Dr
- 3001 47th St