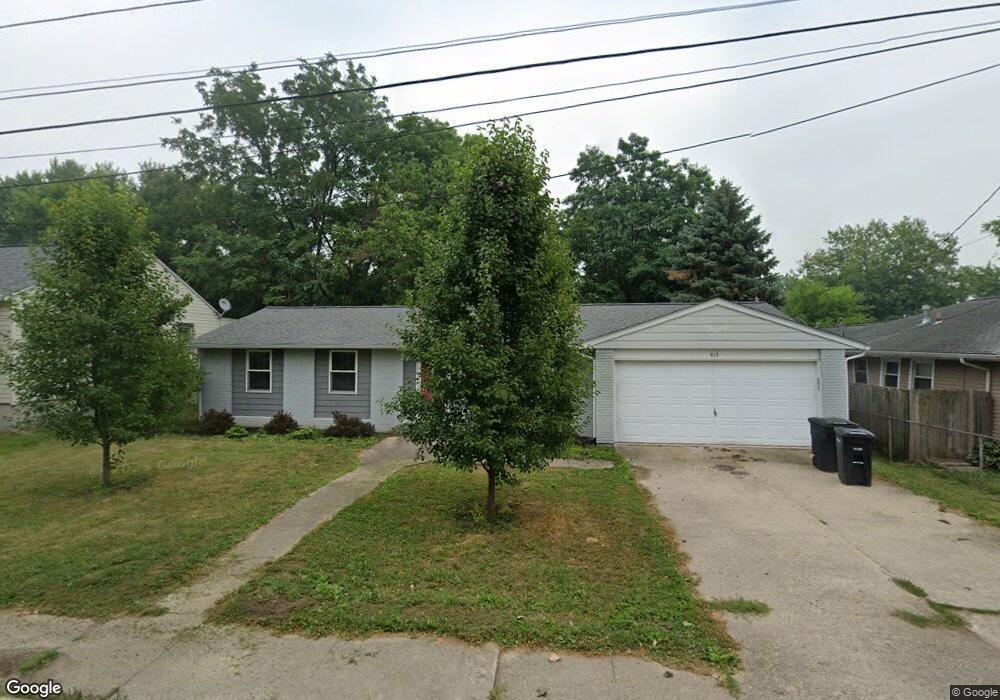
913 S 23rd St Lafayette, IN 47905
South Oakland NeighborhoodEstimated Value: $188,000 - $200,920
--
Bed
--
Bath
1,080
Sq Ft
$180/Sq Ft
Est. Value
About This Home
This home is located at 913 S 23rd St, Lafayette, IN 47905 and is currently estimated at $194,480, approximately $180 per square foot. 913 S 23rd St is a home located in Tippecanoe County with nearby schools including Oakland Elementary School, Lafayette Tecumseh Junior High School, and Sunnyside Intermediate School.
Ownership History
Date
Name
Owned For
Owner Type
Purchase Details
Closed on
Jul 29, 2021
Sold by
Whiteaker Timothy W
Bought by
Baer David and Baer Jacquelyn
Current Estimated Value
Purchase Details
Closed on
Dec 27, 2019
Sold by
Whlteaker Patrick and Whlteaker Tyler
Bought by
Whlteaker Timothy W
Purchase Details
Closed on
Jun 1, 2018
Sold by
Synesael Robert
Bought by
Whiteaker Patrick and Whiteaker Tyler
Purchase Details
Closed on
Apr 6, 2011
Sold by
Tarter Lula K
Bought by
Synesael Robert
Create a Home Valuation Report for This Property
The Home Valuation Report is an in-depth analysis detailing your home's value as well as a comparison with similar homes in the area
Home Values in the Area
Average Home Value in this Area
Purchase History
| Date | Buyer | Sale Price | Title Company |
|---|---|---|---|
| Baer David | $170,000 | Metropolitan Title | |
| Whlteaker Timothy W | -- | Metropolitan Title Indiana | |
| Whiteaker Patrick | -- | None Available | |
| Synesael Robert | -- | None Available |
Source: Public Records
Tax History Compared to Growth
Tax History
| Year | Tax Paid | Tax Assessment Tax Assessment Total Assessment is a certain percentage of the fair market value that is determined by local assessors to be the total taxable value of land and additions on the property. | Land | Improvement |
|---|---|---|---|---|
| 2024 | $2,469 | $123,400 | $16,000 | $107,400 |
| 2023 | $2,284 | $114,100 | $16,000 | $98,100 |
| 2022 | $2,145 | $107,100 | $16,000 | $91,100 |
| 2021 | $717 | $95,300 | $16,000 | $79,300 |
| 2020 | $567 | $86,700 | $16,000 | $70,700 |
| 2019 | $650 | $92,600 | $24,600 | $68,000 |
| 2018 | $675 | $89,400 | $24,600 | $64,800 |
| 2017 | $636 | $87,400 | $24,600 | $62,800 |
| 2016 | $442 | $74,800 | $24,600 | $50,200 |
| 2014 | $410 | $71,000 | $24,600 | $46,400 |
| 2013 | $397 | $69,700 | $24,600 | $45,100 |
Source: Public Records
Map
Nearby Homes