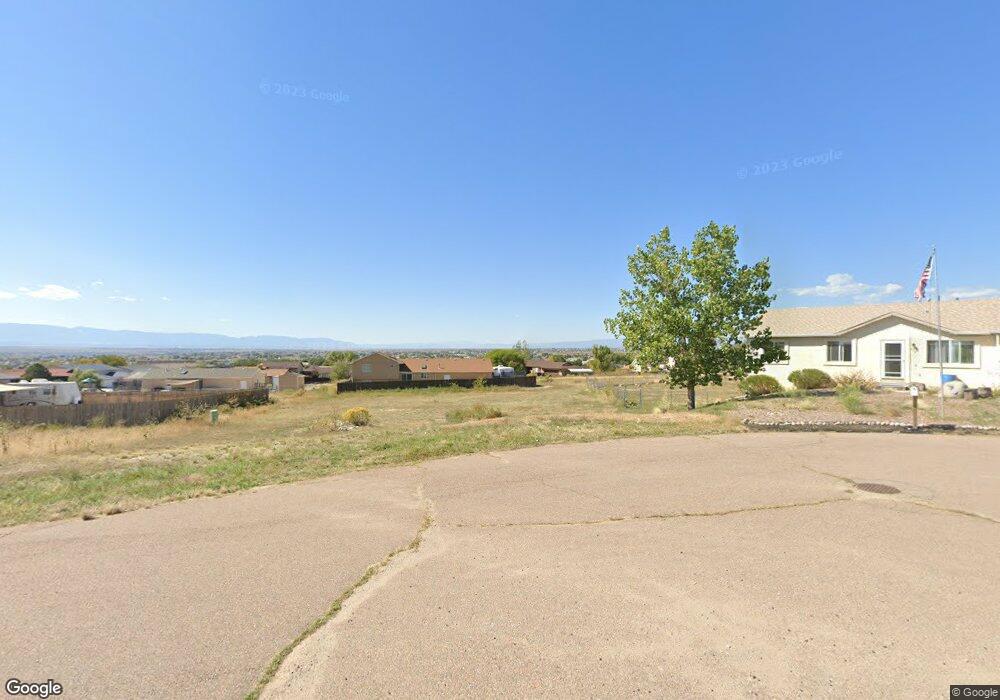
913 S Elgin Ct Pueblo West, CO 81007
Estimated Value: $314,000 - $366,237
3
Beds
2
Baths
1,456
Sq Ft
$235/Sq Ft
Est. Value
About This Home
This home is located at 913 S Elgin Ct, Pueblo West, CO 81007 and is currently estimated at $342,809, approximately $235 per square foot. 913 S Elgin Ct is a home located in Pueblo County with nearby schools including Desert Sage Elementary School, Liberty Point International School, and Pueblo West High School.
Ownership History
Date
Name
Owned For
Owner Type
Purchase Details
Closed on
May 5, 2017
Sold by
Schroeder Linda L and Thorson Randy W
Bought by
Clark Kenneth H and Clark Brenda J
Current Estimated Value
Home Financials for this Owner
Home Financials are based on the most recent Mortgage that was taken out on this home.
Original Mortgage
$176,641
Outstanding Balance
$147,420
Interest Rate
4.23%
Mortgage Type
FHA
Estimated Equity
$195,390
Purchase Details
Closed on
Aug 7, 2015
Sold by
Schroeder Harlan E
Bought by
Thorson Linda L and Thorson Randy W
Purchase Details
Closed on
Nov 16, 2011
Sold by
Schroeder Harlan E
Bought by
Schroeder Harlan E and Schroeder Harlan E
Purchase Details
Closed on
Sep 23, 2003
Sold by
Gem Homes Inc
Bought by
Schroeder Harlan E + Patsy L
Purchase Details
Closed on
May 31, 2003
Sold by
Kalani Wayne J + Sharon P
Bought by
Gem Homes Inc
Purchase Details
Closed on
Oct 17, 1979
Sold by
Lawyers Title Of Pueblo
Bought by
Kalani Wayne J + Sharon P
Create a Home Valuation Report for This Property
The Home Valuation Report is an in-depth analysis detailing your home's value as well as a comparison with similar homes in the area
Home Values in the Area
Average Home Value in this Area
Purchase History
| Date | Buyer | Sale Price | Title Company |
|---|---|---|---|
| Clark Kenneth H | $179,900 | Land Title Guarantee Company | |
| Thorson Linda L | -- | None Available | |
| Schroeder Harlan E | -- | None Available | |
| Schroeder Harlan E + Patsy L | $126,000 | -- | |
| Gem Homes Inc | $11,000 | -- | |
| Kalani Wayne J + Sharon P | $5,800 | -- |
Source: Public Records
Mortgage History
| Date | Status | Borrower | Loan Amount |
|---|---|---|---|
| Open | Clark Kenneth H | $176,641 |
Source: Public Records
Tax History Compared to Growth
Tax History
| Year | Tax Paid | Tax Assessment Tax Assessment Total Assessment is a certain percentage of the fair market value that is determined by local assessors to be the total taxable value of land and additions on the property. | Land | Improvement |
|---|---|---|---|---|
| 2024 | $1,878 | $18,710 | -- | -- |
| 2023 | $1,900 | $22,400 | $3,120 | $19,280 |
| 2022 | $1,484 | $14,788 | $2,050 | $12,738 |
| 2021 | $1,521 | $15,210 | $2,110 | $13,100 |
| 2020 | $1,396 | $15,210 | $2,110 | $13,100 |
| 2019 | $1,392 | $13,927 | $679 | $13,248 |
| 2018 | $1,190 | $11,904 | $504 | $11,400 |
| 2017 | $1,192 | $11,904 | $504 | $11,400 |
| 2016 | $1,149 | $11,495 | $661 | $10,834 |
| 2015 | $1,139 | $11,495 | $661 | $10,834 |
| 2014 | $1,045 | $10,539 | $661 | $9,878 |
Source: Public Records
Map
Nearby Homes
- 919 S Elgin Ct
- 265 W Delray Dr
- 213 W Palomar Plaza
- 866 S Harmony Dr
- 896 S Harmony Dr
- 946 S Greenway Ave
- 914 S Greenway Ave
- 873 S Harmony Dr
- 808 S Palomar Dr
- 871 S Harmony Dr Unit 873
- 865 S Harmony Dr
- 880 S Concho Place
- 263 W Laurue Ln
- 264 W Laurue Ln
- 994 S Alexis Ln
- 987 S Blue Hills Dr
- 211 W Harmony Dr
- 817 S Aguilar Ln
- 745 S Greenway Ave
- 223 W Harmony Dr Unit A & B
- 919 S Elgin Ct Unit 22
- 925 S Elgin Ct Unit 23
- 911 S Elgin Ct
- 257 W Elgin Dr
- 920 S Elgin Place
- 263 W Elgin Dr Unit 25
- 910 S Elgin Ct
- 918 S Elgin Ct
- 262 W Delray Dr
- 245 W Elgin Dr
- 227 W Elgin Dr Unit 6
- 269 W Elgin Dr Unit 26
- 215 W Elgin Dr Unit 3
- 245 W Elgin Dr Unit 18
- 268 W Delray Dr
- 926 S Elgin Place
- 239 W Elgin Dr
- 239 W Elgin Dr Unit 17
- 254 W Delray Dr
- 274 W Delray Dr