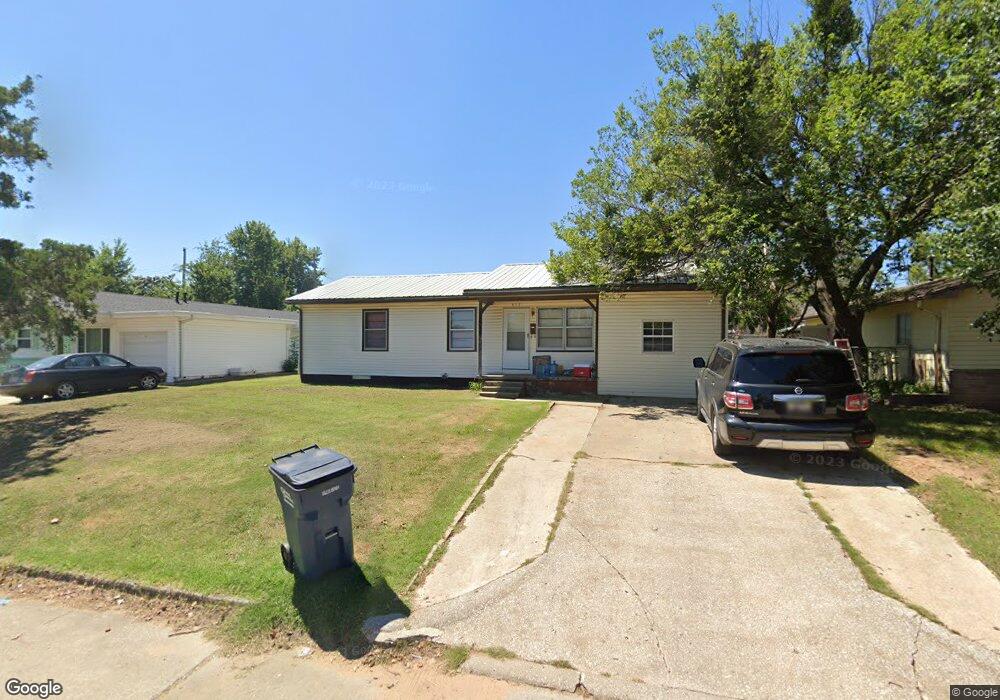
913 Sampson St Seminole, OK 74868
Estimated Value: $73,000 - $130,000
3
Beds
1
Bath
1,200
Sq Ft
$82/Sq Ft
Est. Value
About This Home
This home is located at 913 Sampson St, Seminole, OK 74868 and is currently estimated at $98,898, approximately $82 per square foot. 913 Sampson St is a home located in Seminole County with nearby schools including Wilson Elementary School, Northwood Elementary School, and Seminole Middle School.
Ownership History
Date
Name
Owned For
Owner Type
Purchase Details
Closed on
Sep 17, 2009
Sold by
Trammell Mary Joan and Jones Marilyn Sue
Bought by
Properties To Grow Llc
Current Estimated Value
Purchase Details
Closed on
Dec 15, 2008
Sold by
Trammelli Mary Joan and Jones Marilyn Sue
Bought by
Properties To Grow Llc
Purchase Details
Closed on
Jun 25, 2008
Sold by
Trammell Mary Joan
Bought by
Jones Marilyn Sue and Jones Michael Glenn
Purchase Details
Closed on
Sep 27, 2007
Sold by
Trammell Mary Joan
Bought by
Jones Marilyn Sue and Jones Michael Glenn
Create a Home Valuation Report for This Property
The Home Valuation Report is an in-depth analysis detailing your home's value as well as a comparison with similar homes in the area
Home Values in the Area
Average Home Value in this Area
Purchase History
| Date | Buyer | Sale Price | Title Company |
|---|---|---|---|
| Properties To Grow Llc | -- | None Available | |
| Properties To Grow Llc | -- | None Available | |
| Jones Marilyn Sue | -- | None Available | |
| Jones Marilyn Sue | -- | None Available |
Source: Public Records
Tax History Compared to Growth
Tax History
| Year | Tax Paid | Tax Assessment Tax Assessment Total Assessment is a certain percentage of the fair market value that is determined by local assessors to be the total taxable value of land and additions on the property. | Land | Improvement |
|---|---|---|---|---|
| 2024 | $487 | $4,824 | $414 | $4,410 |
| 2023 | $487 | $4,594 | $399 | $4,195 |
| 2022 | $426 | $4,375 | $383 | $3,992 |
| 2021 | $404 | $4,375 | $383 | $3,992 |
| 2020 | $392 | $3,969 | $354 | $3,615 |
| 2019 | $380 | $3,780 | $340 | $3,440 |
| 2018 | $349 | $3,600 | $402 | $3,198 |
| 2017 | $255 | $3,429 | $383 | $3,046 |
| 2016 | $243 | $3,265 | $377 | $2,888 |
| 2015 | $288 | $3,110 | $660 | $2,450 |
| 2014 | $293 | $3,110 | $660 | $2,450 |
Source: Public Records
Map
Nearby Homes
- 917 Sampson St
- 909 Sampson St
- 905 Sampson St
- 921 Sampson St
- 912 Cherokee St
- 1816 Oakridge Dr
- 916 Cherokee St
- 908 Cherokee St
- 920 Cherokee St
- 912 Sampson St
- 904 Cherokee St
- 925 Sampson St
- 908 Sampson St
- 916 Sampson St
- 1800 Oakridge Dr
- 904 Sampson St
- 920 Sampson St
- 1808 Oakridge Dr
- 924 Cherokee St
- 924 Sampson St