Estimated Value: $302,000 - $342,957
3
Beds
2
Baths
1,550
Sq Ft
$206/Sq Ft
Est. Value
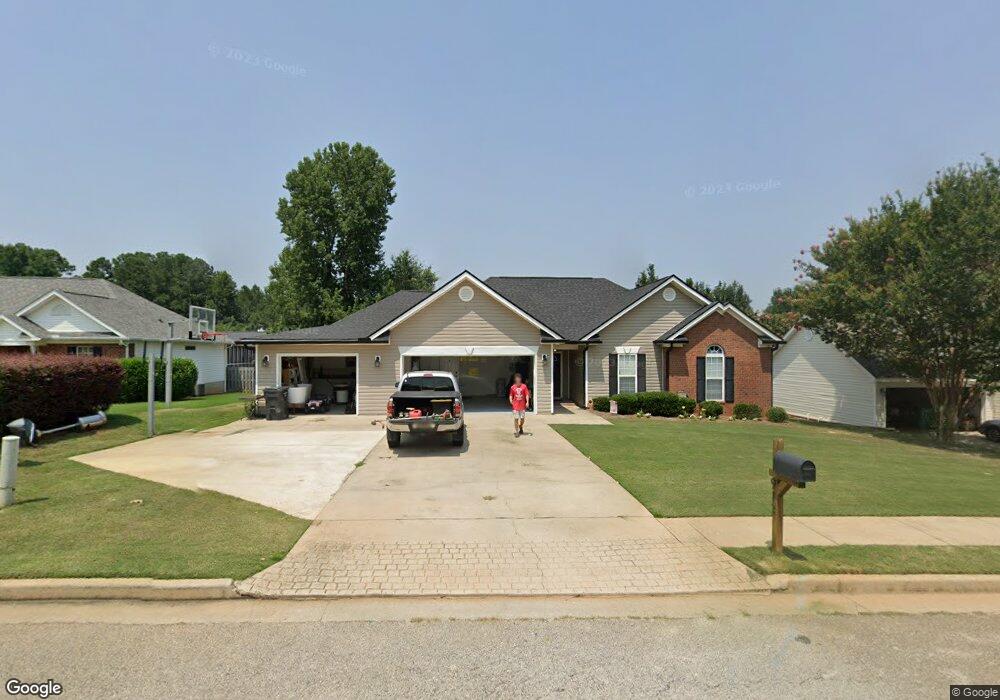
About This Home
This home is located at 913 Sawbuck Way, Evans, GA 30809 and is currently estimated at $319,489, approximately $206 per square foot. 913 Sawbuck Way is a home located in Columbia County with nearby schools including River Ridge Elementary School, Riverside Middle School, and Greenbrier High School.
Ownership History
Date
Name
Owned For
Owner Type
Purchase Details
Closed on
Apr 1, 2022
Sold by
Ramp Lyn F
Bought by
Dukes Phillip and Dukes Mckenzie H
Current Estimated Value
Home Financials for this Owner
Home Financials are based on the most recent Mortgage that was taken out on this home.
Original Mortgage
$248,000
Outstanding Balance
$231,633
Interest Rate
3.89%
Mortgage Type
New Conventional
Estimated Equity
$87,856
Purchase Details
Closed on
Jul 17, 2017
Sold by
Ramp Amber S
Bought by
Ramp Lyn F
Purchase Details
Closed on
Nov 10, 2003
Sold by
Sid Beckum Construction Inc
Bought by
Ramp Lyn F and Ramp Amber S
Home Financials for this Owner
Home Financials are based on the most recent Mortgage that was taken out on this home.
Original Mortgage
$116,900
Interest Rate
5.75%
Mortgage Type
Purchase Money Mortgage
Create a Home Valuation Report for This Property
The Home Valuation Report is an in-depth analysis detailing your home's value as well as a comparison with similar homes in the area
Home Values in the Area
Average Home Value in this Area
Purchase History
| Date | Buyer | Sale Price | Title Company |
|---|---|---|---|
| Dukes Phillip | $310,000 | -- | |
| Ramp Lyn F | -- | -- | |
| Ramp Lyn F | $136,900 | -- |
Source: Public Records
Mortgage History
| Date | Status | Borrower | Loan Amount |
|---|---|---|---|
| Open | Dukes Phillip | $248,000 | |
| Previous Owner | Ramp Lyn F | $116,900 |
Source: Public Records
Tax History Compared to Growth
Tax History
| Year | Tax Paid | Tax Assessment Tax Assessment Total Assessment is a certain percentage of the fair market value that is determined by local assessors to be the total taxable value of land and additions on the property. | Land | Improvement |
|---|---|---|---|---|
| 2025 | $3,563 | $146,966 | $20,104 | $126,862 |
| 2024 | $3,579 | $140,928 | $19,004 | $121,924 |
| 2023 | $3,579 | $124,000 | $17,880 | $106,120 |
| 2022 | $3,058 | $115,436 | $16,904 | $98,532 |
| 2021 | $2,858 | $102,962 | $14,604 | $88,358 |
| 2020 | $2,717 | $95,756 | $13,504 | $82,252 |
| 2019 | $2,519 | $88,626 | $13,704 | $74,922 |
| 2018 | $2,613 | $91,710 | $12,904 | $78,806 |
| 2017 | $2,140 | $74,463 | $13,504 | $60,959 |
| 2016 | $1,958 | $70,452 | $11,580 | $58,872 |
| 2015 | $1,889 | $67,765 | $11,380 | $56,385 |
| 2014 | $1,910 | $67,690 | $10,480 | $57,210 |
Source: Public Records
Map
Nearby Homes
- 905 River Bound Ct
- 1144 Hunters Cove
- 1142 Hunters Cove
- 4116 Fox Brush Dr
- 2003 Sumter Landing Cir
- 4196 Aerie Cir
- 1595 River Island Pkwy
- 1076 Conn Dr
- 1088 Conn Dr
- 1027 Sluice Gate Dr
- 1085 Conn Dr
- 1015 Sluice Gate Dr
- 4161 Eagle Nest Dr
- 4183 Quinn Dr
- 877 Chase Rd
- 756 Winding Creek Ct
- 1103 Sumter Landing Cir
- 322 Pump House Rd
- 2049 Egret Cir
- 714 Marsh Point Rd
- 915 Sawbuck Way
- 5103 Saddle Cir
- 5103 Saddle Cir
- 5182 Saddle Cir
- 5184 Saddle Cir
- 917 Sawbuck Way
- 5180 Saddle Cir
- 5186 Saddle Cir
- 912 Sawbuck Way
- 5178 Saddle Cir
- 919 Sawbuck Way
- 914 Sawbuck Way
- 910 Sawbuck Way
- 916 Sawbuck Way
- 921 Sawbuck Way
- 5102 Saddle Cir
- 907 Sawbuck Way
- 918 Sawbuck Way
- 5115 Saddle Cir
- 5174 Saddle Cir