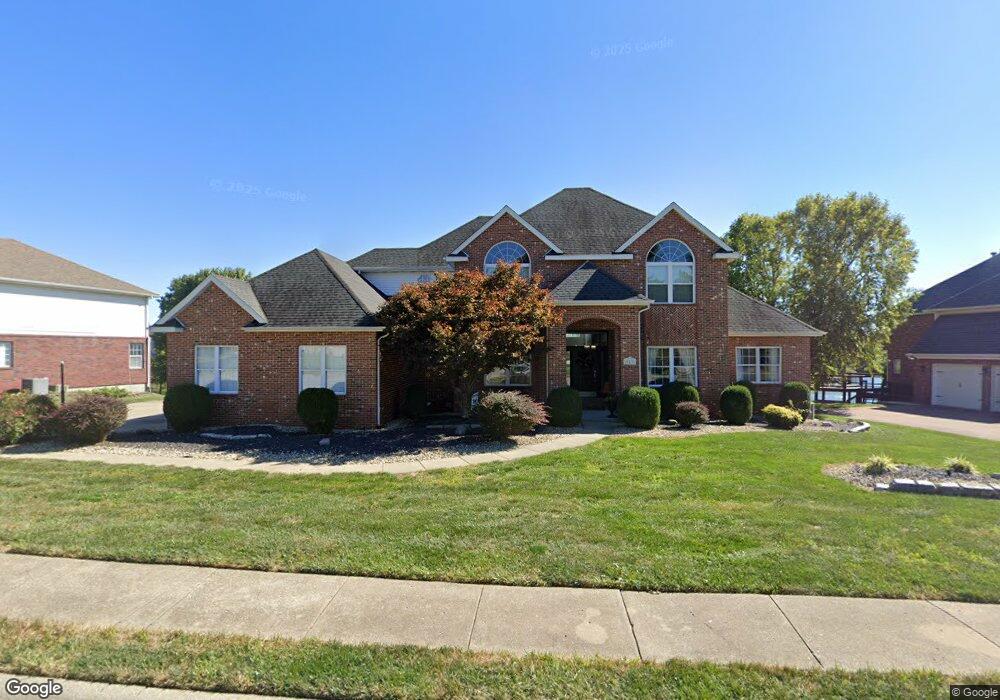
913 Thornbury Place O Fallon, IL 62269
Estimated Value: $559,052 - $595,000
--
Bed
--
Bath
1,298
Sq Ft
$439/Sq Ft
Est. Value
About This Home
This home is located at 913 Thornbury Place, O Fallon, IL 62269 and is currently estimated at $570,263, approximately $439 per square foot. 913 Thornbury Place is a home located in St. Clair County with nearby schools including Moye Elementary School, Carriel Junior High School, and O'Fallon Township High School.
Ownership History
Date
Name
Owned For
Owner Type
Purchase Details
Closed on
Nov 12, 2024
Sold by
Mandis Penelope and Mandis Michael
Bought by
Mandis Penelope and Mandis Revocable Trust
Current Estimated Value
Purchase Details
Closed on
Jun 21, 2016
Sold by
Mandis Michael E
Bought by
Mandis Michael E and Mandis Penelope M
Purchase Details
Closed on
Jun 6, 2005
Sold by
Maddox Robert J and Maddox Nina F
Bought by
Mandis Michael E
Home Financials for this Owner
Home Financials are based on the most recent Mortgage that was taken out on this home.
Original Mortgage
$410,000
Interest Rate
5.85%
Mortgage Type
Purchase Money Mortgage
Create a Home Valuation Report for This Property
The Home Valuation Report is an in-depth analysis detailing your home's value as well as a comparison with similar homes in the area
Home Values in the Area
Average Home Value in this Area
Purchase History
| Date | Buyer | Sale Price | Title Company |
|---|---|---|---|
| Mandis Penelope | -- | None Available | |
| Mandis Michael E | -- | Abstracts & Titles Inc | |
| Mandis Michael E | $410,000 | First County Title |
Source: Public Records
Mortgage History
| Date | Status | Borrower | Loan Amount |
|---|---|---|---|
| Previous Owner | Mandis Michael E | $410,000 |
Source: Public Records
Tax History Compared to Growth
Tax History
| Year | Tax Paid | Tax Assessment Tax Assessment Total Assessment is a certain percentage of the fair market value that is determined by local assessors to be the total taxable value of land and additions on the property. | Land | Improvement |
|---|---|---|---|---|
| 2024 | $12,247 | $179,008 | $28,368 | $150,640 |
| 2023 | $11,583 | $158,878 | $25,178 | $133,700 |
| 2022 | $10,916 | $146,068 | $23,148 | $122,920 |
| 2021 | $10,745 | $141,340 | $23,222 | $118,118 |
| 2020 | $10,662 | $133,791 | $21,982 | $111,809 |
| 2019 | $10,416 | $133,791 | $21,982 | $111,809 |
| 2018 | $10,135 | $129,907 | $21,344 | $108,563 |
| 2017 | $10,333 | $127,742 | $24,224 | $103,518 |
| 2016 | $10,299 | $124,761 | $23,659 | $101,102 |
| 2014 | $9,523 | $123,318 | $23,385 | $99,933 |
| 2013 | $9,781 | $120,678 | $23,026 | $97,652 |
Source: Public Records
Map
Nearby Homes
- 710 Victoria Ln
- 809 E Deer Creek Rd
- 712 Lonnie Ct
- 1509 Cedar Ridge Dr
- 678 Janeita Ct
- 1676 Lancaster Dr
- 1501 Keck Ridge Dr
- 1342 Stone Creek Dr
- 1217 Dempcy Ln
- 108 Chickasaw Ln
- 109 Callaway Ct
- 1588 Turn Creek Ct
- 14 Shallowbrook Dr
- 1010 N Smiley St
- 30 Shallowbrook Dr
- 157 Knob Creek Ln
- 1830 Riviera Ln
- 1845 Riviera Ln
- 171 Picketts Run
- 101 E Brittany Ln
- 917 Thornbury Place
- 909 Thornbury Place
- 802 Chiswick Ct
- 905 Thornbury Place
- 918 Thornbury Place
- 709 Victoria Ln
- 801 Chiswick Ct
- 925 Thornbury Place
- 901 Thornbury Place
- 806 Chiswick Ct
- 713 Victoria Ln
- 805 Chiswick Ct
- 705 Victoria Ln
- 922 Thornbury Place
- 717 Victoria Ln
- 909 Jordan
- 913 Jordan Dr
- 913 Jordan
- 905 Jordan
- 929 Thornbury Place