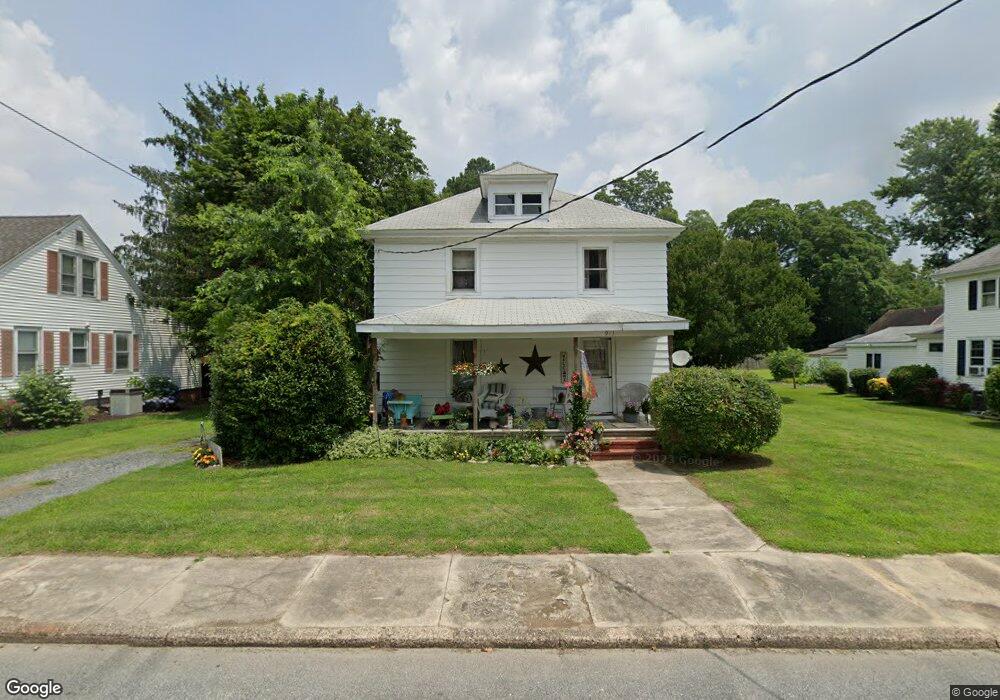
913 Walnut St Pocomoke City, MD 21851
Estimated Value: $164,773 - $227,000
--
Bed
2
Baths
1,624
Sq Ft
$124/Sq Ft
Est. Value
About This Home
This home is located at 913 Walnut St, Pocomoke City, MD 21851 and is currently estimated at $201,943, approximately $124 per square foot. 913 Walnut St is a home located in Worcester County with nearby schools including Pocomoke Elementary School, Pocomoke Middle School, and Pocomoke High School.
Ownership History
Date
Name
Owned For
Owner Type
Purchase Details
Closed on
Sep 30, 1985
Sold by
Fuselier Gary K
Bought by
Young Joan E
Current Estimated Value
Home Financials for this Owner
Home Financials are based on the most recent Mortgage that was taken out on this home.
Original Mortgage
$27,600
Interest Rate
12.17%
Purchase Details
Closed on
Dec 11, 1981
Sold by
Byrd William R and Byrd Charles W
Bought by
Fuselier Gary K
Home Financials for this Owner
Home Financials are based on the most recent Mortgage that was taken out on this home.
Original Mortgage
$16,800
Interest Rate
16.94%
Create a Home Valuation Report for This Property
The Home Valuation Report is an in-depth analysis detailing your home's value as well as a comparison with similar homes in the area
Home Values in the Area
Average Home Value in this Area
Purchase History
| Date | Buyer | Sale Price | Title Company |
|---|---|---|---|
| Young Joan E | $34,500 | -- | |
| Fuselier Gary K | $22,000 | -- |
Source: Public Records
Mortgage History
| Date | Status | Borrower | Loan Amount |
|---|---|---|---|
| Closed | Young Joan E | $27,600 | |
| Previous Owner | Fuselier Gary K | $16,800 |
Source: Public Records
Tax History Compared to Growth
Tax History
| Year | Tax Paid | Tax Assessment Tax Assessment Total Assessment is a certain percentage of the fair market value that is determined by local assessors to be the total taxable value of land and additions on the property. | Land | Improvement |
|---|---|---|---|---|
| 2025 | $2,587 | $126,300 | $24,600 | $101,700 |
| 2024 | $2,149 | $103,400 | $0 | $0 |
| 2023 | $1,673 | $80,500 | $0 | $0 |
| 2022 | $1,197 | $57,600 | $24,600 | $33,000 |
| 2021 | $1,203 | $57,600 | $24,600 | $33,000 |
| 2020 | $1,203 | $57,600 | $24,600 | $33,000 |
| 2019 | $1,224 | $58,600 | $24,600 | $34,000 |
| 2018 | $1,202 | $58,100 | $0 | $0 |
| 2017 | $1,197 | $57,600 | $0 | $0 |
| 2016 | $1,222 | $57,100 | $0 | $0 |
| 2015 | $1,073 | $57,100 | $0 | $0 |
| 2014 | $1,073 | $57,100 | $0 | $0 |
Source: Public Records
Map
Nearby Homes