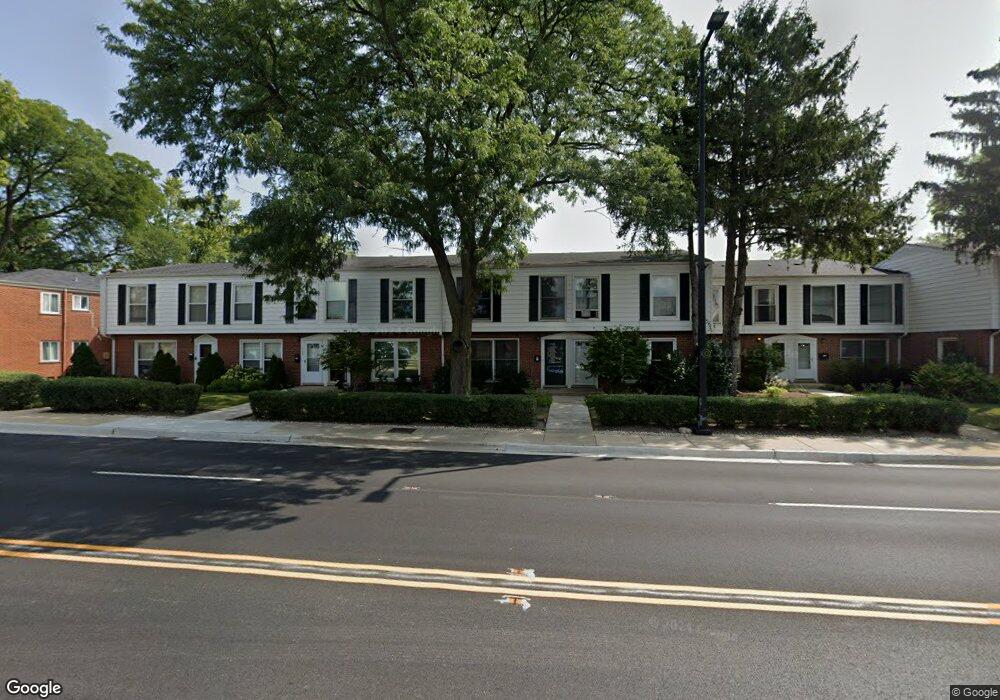
913 Waukegan Rd Unit B Deerfield, IL 60015
Estimated Value: $312,000 - $384,000
3
Beds
2
Baths
1,216
Sq Ft
$284/Sq Ft
Est. Value
About This Home
This home is located at 913 Waukegan Rd Unit B, Deerfield, IL 60015 and is currently estimated at $345,339, approximately $283 per square foot. 913 Waukegan Rd Unit B is a home located in Lake County with nearby schools including Kipling Elementary School, Alan B Shepard Middle School, and Deerfield High School.
Ownership History
Date
Name
Owned For
Owner Type
Purchase Details
Closed on
Jan 15, 1999
Sold by
Anderson Burr E and Anderson Margaret A
Bought by
Kamen Jonathan and Kamen Kristi J
Current Estimated Value
Home Financials for this Owner
Home Financials are based on the most recent Mortgage that was taken out on this home.
Original Mortgage
$105,000
Outstanding Balance
$23,789
Interest Rate
6.75%
Estimated Equity
$321,550
Purchase Details
Closed on
Nov 13, 1996
Sold by
Fredenburg Lila D and Anderson Lila D
Bought by
Anderson Burr E and Anderson Margaret A
Home Financials for this Owner
Home Financials are based on the most recent Mortgage that was taken out on this home.
Original Mortgage
$95,000
Interest Rate
6.25%
Create a Home Valuation Report for This Property
The Home Valuation Report is an in-depth analysis detailing your home's value as well as a comparison with similar homes in the area
Home Values in the Area
Average Home Value in this Area
Purchase History
| Date | Buyer | Sale Price | Title Company |
|---|---|---|---|
| Kamen Jonathan | $133,000 | -- | |
| Anderson Burr E | $107,500 | Rei Title |
Source: Public Records
Mortgage History
| Date | Status | Borrower | Loan Amount |
|---|---|---|---|
| Open | Kamen Jonathan | $105,000 | |
| Previous Owner | Anderson Burr E | $95,000 |
Source: Public Records
Tax History Compared to Growth
Tax History
| Year | Tax Paid | Tax Assessment Tax Assessment Total Assessment is a certain percentage of the fair market value that is determined by local assessors to be the total taxable value of land and additions on the property. | Land | Improvement |
|---|---|---|---|---|
| 2024 | $7,440 | $90,726 | $18,536 | $72,190 |
| 2023 | $7,440 | $87,069 | $17,789 | $69,280 |
| 2022 | $4,657 | $55,145 | $18,744 | $36,401 |
| 2021 | $4,379 | $53,167 | $18,072 | $35,095 |
| 2020 | $4,212 | $53,279 | $18,110 | $35,169 |
| 2019 | $4,120 | $53,188 | $18,079 | $35,109 |
| 2018 | $3,748 | $50,778 | $19,161 | $31,617 |
| 2017 | $3,717 | $50,616 | $19,100 | $31,516 |
| 2016 | $3,600 | $48,702 | $18,378 | $30,324 |
| 2015 | $3,502 | $45,760 | $17,268 | $28,492 |
| 2014 | $4,388 | $55,135 | $17,391 | $37,744 |
| 2012 | $4,295 | $54,649 | $17,238 | $37,411 |
Source: Public Records
Map
Nearby Homes
- 828 Chestnut St
- 1030 Chestnut St
- 606 Longfellow Ave
- 904 Forest Ave
- 1211 Norman Ln
- 630 Hermitage Dr
- 757 Kipling Place
- 953 Clay Ct
- 1041 Sheridan Ave
- 1127 Kenton Rd
- 602 Warwick Rd
- 970 Ivy Ln Unit C
- 1052 Greenwood Ave
- 1027 Central Ave
- 834 Poplar Ln
- 1117 Osterman Ave
- 435 Elm St Unit 4G
- 1423 Northwoods Rd
- 1316 Barclay Ln Unit 13
- 1504 Northwoods Rd
- 913 Waukegan Rd Unit A
- 915 Waukegan Rd Unit B
- 915 Waukegan Rd Unit A
- 907 Waukegan Rd Unit B
- 907 Waukegan Rd Unit A
- 917 Waukegan Rd
- 911 Waukegan Rd Unit B
- 909 Waukegan Rd
- 905 Waukegan Rd Unit A
- 905 Waukegan Rd Unit B
- 901 Waukegan Rd Unit B
- 901 Waukegan Rd Unit A
- 933-951 Waukegan Rd Unit 1 Bedroom
- 933-951 Waukegan Rd
- 903 Waukegan Rd Unit A
- 903 Waukegan Rd Unit B
- 903 Waukegan Rd
- 928 Caroline Ct Unit 9A
- 924 Caroline Ct Unit 9B
- 924 Caroline Ct Unit 1