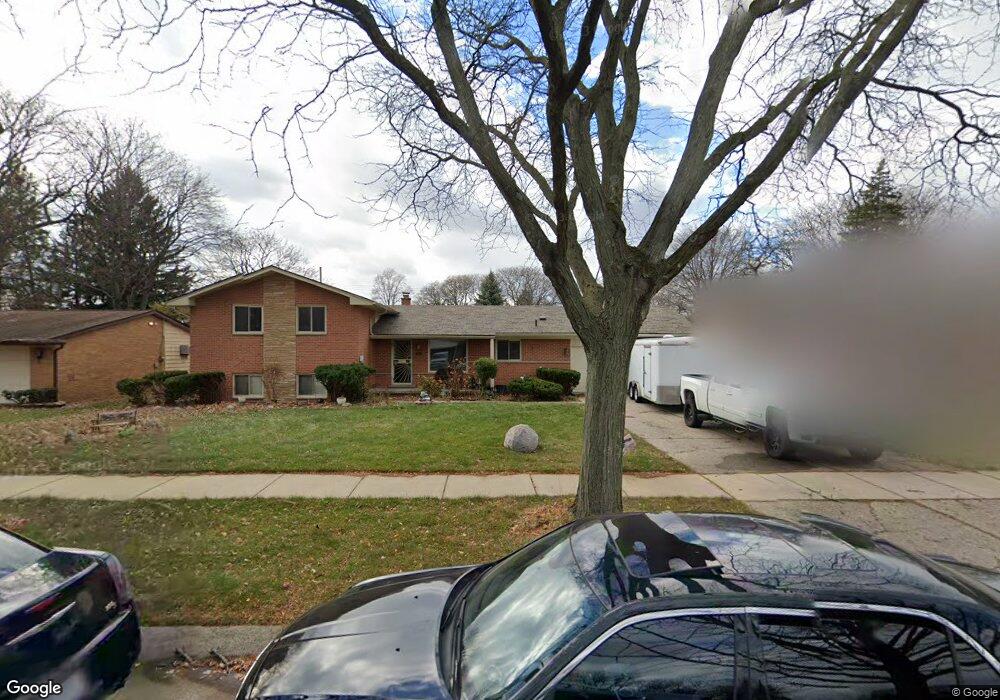
9131 Hazelton Redford, MI 48239
Estimated Value: $251,000 - $277,000
5
Beds
3
Baths
2,342
Sq Ft
$111/Sq Ft
Est. Value
About This Home
This home is located at 9131 Hazelton, Redford, MI 48239 and is currently estimated at $260,702, approximately $111 per square foot. 9131 Hazelton is a home located in Wayne County with nearby schools including John D. Pierce Middle School, Lee M. Thurston High School, and Global Heights Academy.
Ownership History
Date
Name
Owned For
Owner Type
Purchase Details
Closed on
Jan 15, 2020
Sold by
Thompson Anthony L
Bought by
Ministries Saint Zion and Thompson Anthony
Current Estimated Value
Purchase Details
Closed on
Oct 19, 2010
Sold by
Wells Fargo Bank Na
Bought by
Federal National Mortgage Association
Purchase Details
Closed on
Oct 13, 2010
Sold by
Parker Jerry C and Parker Brenda K
Bought by
Wells Fargo Bank Na
Purchase Details
Closed on
Oct 11, 1995
Sold by
Parke Jerry C and Parke Brenda K
Bought by
Parker Jerry C and Parker Brenda K
Create a Home Valuation Report for This Property
The Home Valuation Report is an in-depth analysis detailing your home's value as well as a comparison with similar homes in the area
Home Values in the Area
Average Home Value in this Area
Purchase History
| Date | Buyer | Sale Price | Title Company |
|---|---|---|---|
| Ministries Saint Zion | -- | None Available | |
| Saint Zion Ministries | -- | None Listed On Document | |
| Federal National Mortgage Association | -- | None Available | |
| Wells Fargo Bank Na | $138,923 | None Available | |
| Parker Jerry C | $132,000 | -- |
Source: Public Records
Tax History Compared to Growth
Tax History
| Year | Tax Paid | Tax Assessment Tax Assessment Total Assessment is a certain percentage of the fair market value that is determined by local assessors to be the total taxable value of land and additions on the property. | Land | Improvement |
|---|---|---|---|---|
| 2025 | $1,608 | $112,000 | $0 | $0 |
| 2024 | $1,608 | $109,400 | $0 | $0 |
| 2023 | $1,538 | $115,800 | $0 | $0 |
| 2022 | $3,966 | $96,300 | $0 | $0 |
| 2021 | $4,102 | $90,800 | $0 | $0 |
| 2020 | $3,439 | $78,700 | $0 | $0 |
| 2019 | $2,922 | $64,800 | $0 | $0 |
| 2018 | $984 | $57,700 | $0 | $0 |
| 2017 | $3,402 | $52,200 | $0 | $0 |
| 2016 | $2,652 | $45,900 | $0 | $0 |
| 2015 | $4,130 | $41,300 | $0 | $0 |
| 2013 | $4,500 | $46,000 | $0 | $0 |
| 2012 | $3,902 | $51,400 | $10,200 | $41,200 |
Source: Public Records
Map
Nearby Homes