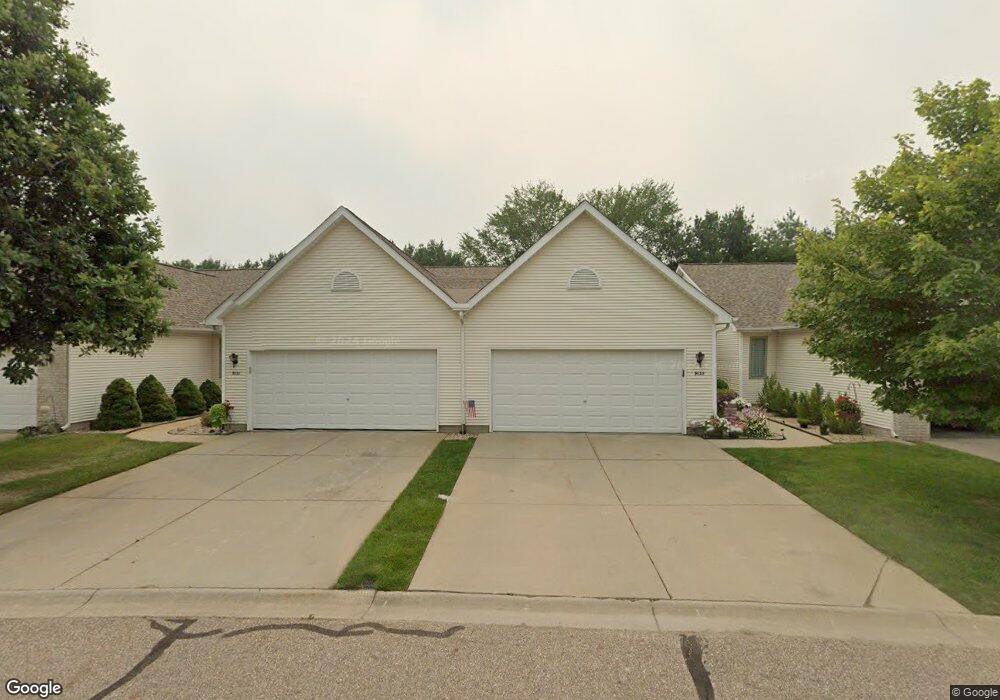
9133 Emily Dr Unit 9133 Davison, MI 48423
Estimated Value: $253,000 - $289,000
--
Bed
3
Baths
1,246
Sq Ft
$215/Sq Ft
Est. Value
About This Home
This home is located at 9133 Emily Dr Unit 9133, Davison, MI 48423 and is currently estimated at $267,971, approximately $215 per square foot. 9133 Emily Dr Unit 9133 is a home located in Genesee County with nearby schools including Thomson Elementary School, Gates Elementary School, and Hill Elementary School.
Ownership History
Date
Name
Owned For
Owner Type
Purchase Details
Closed on
Nov 30, 2016
Sold by
Lemonds Donald L and Lemonds Janice L
Bought by
Trusseell Jeffrey D and Trussell Peggy S
Current Estimated Value
Purchase Details
Closed on
Jun 2, 2014
Sold by
Lemonds Janice L
Bought by
Lemonds Janice and Joint Trust Agreement Of Donald L Lemond
Purchase Details
Closed on
Mar 27, 2013
Sold by
Young John L
Bought by
Lemonds Janice
Purchase Details
Closed on
Jan 7, 2008
Sold by
Young John L and Young Morgan J
Bought by
Young John L
Purchase Details
Closed on
Aug 18, 2003
Sold by
Young John L and Young Senia A
Bought by
Young John L
Purchase Details
Closed on
Jan 15, 2003
Sold by
T L Corp
Bought by
Young John L and Young Senia A
Create a Home Valuation Report for This Property
The Home Valuation Report is an in-depth analysis detailing your home's value as well as a comparison with similar homes in the area
Home Values in the Area
Average Home Value in this Area
Purchase History
| Date | Buyer | Sale Price | Title Company |
|---|---|---|---|
| Trusseell Jeffrey D | $145,000 | Liberty Title | |
| Lemonds Janice | -- | None Available | |
| Lemonds Janice | $97,000 | Mason Burgess Title Agency | |
| Young John L | -- | None Available | |
| Young John L | -- | -- | |
| Young John L | $12,736,000 | Sargents Title Company |
Source: Public Records
Tax History Compared to Growth
Tax History
| Year | Tax Paid | Tax Assessment Tax Assessment Total Assessment is a certain percentage of the fair market value that is determined by local assessors to be the total taxable value of land and additions on the property. | Land | Improvement |
|---|---|---|---|---|
| 2025 | $3,293 | $111,100 | $0 | $0 |
| 2024 | $952 | $103,000 | $0 | $0 |
| 2023 | $909 | $96,300 | $0 | $0 |
| 2022 | $2,959 | $86,000 | $0 | $0 |
| 2021 | $2,934 | $79,100 | $0 | $0 |
| 2020 | $831 | $80,100 | $0 | $0 |
| 2019 | $818 | $73,100 | $0 | $0 |
| 2018 | $2,493 | $67,400 | $0 | $0 |
| 2017 | $2,392 | $67,400 | $0 | $0 |
| 2016 | $1,898 | $65,700 | $0 | $0 |
| 2015 | -- | $60,500 | $0 | $0 |
| 2012 | -- | $45,600 | $45,600 | $0 |
Source: Public Records
Map
Nearby Homes
- 9223 Lapeer Rd
- 00 Lapeer Rd
- 1120 Crystal Wood Dr
- 0 Lapeer Rd Unit G50060188
- 0 Lapeer Rd Unit G50047586
- 1075 Crystal Wood Dr Unit 24
- 9417 Linda Dr
- 1067 Julie Dr
- 9448 Linda Dr
- 527 Amesbury Dr
- 9469 Parkwood N Unit 2B
- 00 E Lippincott Blvd
- VL E Lippincott Blvd
- 8368 E Lippincott Blvd
- 0 Cal Dr
- 9331 Varodell Dr Unit 1
- 0 Fairway Dr
- 2215 Lily Ct
- 304 S State Rd
- 530 Hemlock Dr
- 9133 Emily Dr Unit 200
- 9135 Emily Dr Unit 201
- 9131 Emily Dr Unit 199
- 9129 Emily Dr Unit 198
- 9139 Emily Dr Unit 166
- 9125 Emily Dr Unit 197
- 9141 Emily Dr Unit 167
- 9128 Emily Dr Unit 160
- 9121 Emily Dr Unit 196
- 9143 Emily Dr Unit 168
- 9126 Emily Dr Unit 161
- 9150 Emily Dr Unit 165
- 9119 Emily Dr Unit 195
- 9152 Emily Dr Unit 164
- 9122 Emily Dr
- 9147 Emily Dr
- 9115 Emily Dr Unit 194
- 9149 Emily Dr Unit 170
- 9112 Emily Dr Unit 156
- 9112 Emily Dr Unit 74