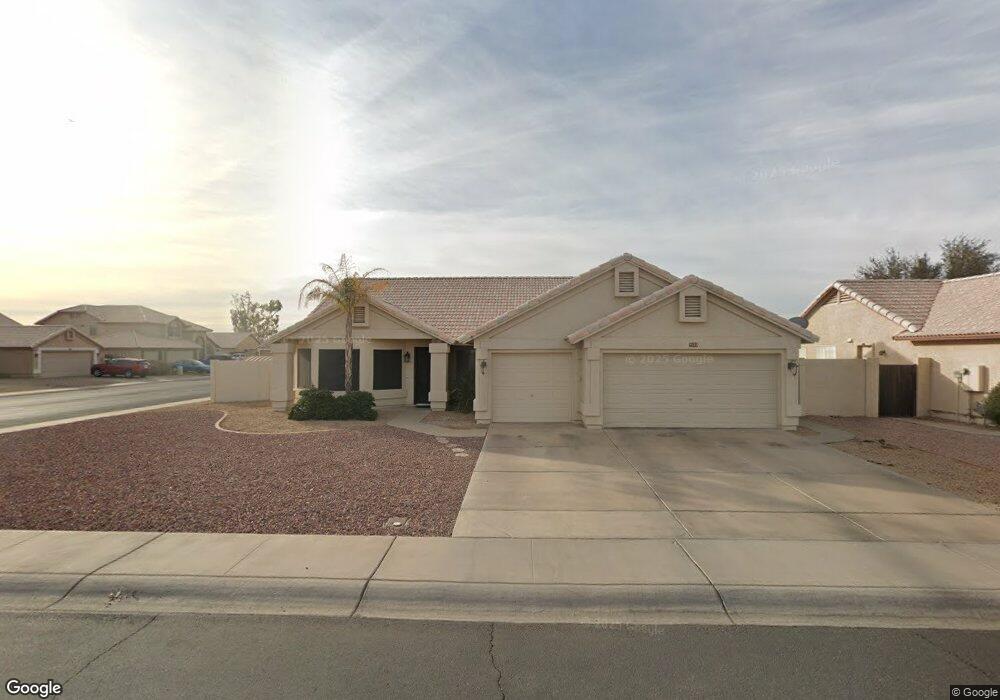
9133 W Crocus Dr Peoria, AZ 85381
Estimated Value: $387,737 - $473,000
3
Beds
2
Baths
1,725
Sq Ft
$254/Sq Ft
Est. Value
About This Home
This home is located at 9133 W Crocus Dr, Peoria, AZ 85381 and is currently estimated at $438,934, approximately $254 per square foot. 9133 W Crocus Dr is a home located in Maricopa County with nearby schools including Desert Harbor Elementary School, Centennial High School, and Sonoran Science Academy-Peoria.
Ownership History
Date
Name
Owned For
Owner Type
Purchase Details
Closed on
Jul 23, 2008
Sold by
Homesales Inc
Bought by
Lloyd Michael M and Lloyd Brenda S
Current Estimated Value
Purchase Details
Closed on
Jun 10, 2008
Sold by
Baca Donna and Baca Paul
Bought by
Homesales Inc
Purchase Details
Closed on
Aug 24, 2005
Sold by
Warner Warren P and Warner Barbara E
Bought by
Baca Paul and Baca Donna S
Home Financials for this Owner
Home Financials are based on the most recent Mortgage that was taken out on this home.
Original Mortgage
$300,600
Interest Rate
8.12%
Mortgage Type
Purchase Money Mortgage
Purchase Details
Closed on
Mar 17, 1999
Sold by
Cissna David A and Cissna Donna M
Bought by
Warner Warren P and Warner Barbara E
Home Financials for this Owner
Home Financials are based on the most recent Mortgage that was taken out on this home.
Original Mortgage
$50,050
Interest Rate
6.92%
Mortgage Type
New Conventional
Create a Home Valuation Report for This Property
The Home Valuation Report is an in-depth analysis detailing your home's value as well as a comparison with similar homes in the area
Home Values in the Area
Average Home Value in this Area
Purchase History
| Date | Buyer | Sale Price | Title Company |
|---|---|---|---|
| Lloyd Michael M | $192,000 | Security Title Agency | |
| Homesales Inc | $225,050 | First American Title | |
| Baca Paul | $334,000 | Chicago Title Insurance Co | |
| Warner Warren P | $135,500 | Capital Title Agency |
Source: Public Records
Mortgage History
| Date | Status | Borrower | Loan Amount |
|---|---|---|---|
| Previous Owner | Baca Paul | $300,600 | |
| Previous Owner | Warner Warren P | $50,050 |
Source: Public Records
Tax History Compared to Growth
Tax History
| Year | Tax Paid | Tax Assessment Tax Assessment Total Assessment is a certain percentage of the fair market value that is determined by local assessors to be the total taxable value of land and additions on the property. | Land | Improvement |
|---|---|---|---|---|
| 2025 | $1,804 | $19,849 | -- | -- |
| 2024 | $1,820 | $18,903 | -- | -- |
| 2023 | $1,820 | $32,870 | $6,570 | $26,300 |
| 2022 | $1,784 | $24,610 | $4,920 | $19,690 |
| 2021 | $1,868 | $22,520 | $4,500 | $18,020 |
| 2020 | $1,880 | $21,560 | $4,310 | $17,250 |
| 2019 | $1,823 | $19,260 | $3,850 | $15,410 |
| 2018 | $1,769 | $18,160 | $3,630 | $14,530 |
| 2017 | $1,764 | $16,730 | $3,340 | $13,390 |
| 2016 | $1,744 | $15,900 | $3,180 | $12,720 |
| 2015 | $1,623 | $15,620 | $3,120 | $12,500 |
Source: Public Records
Map
Nearby Homes
- 14407 N 75th Dr
- 14429 N 75th Dr
- 14566 N 90th Ln
- 14610 N Bolivar Dr
- 9169 W Lisbon Ln
- 9150 W Banff Ln
- 14217 N Bolivar Dr
- 14433 N Cameo Dr
- 9405 W Rolling Hills Dr
- 14816 N 90th Ave
- 9413 W Raintree Dr
- 9056 W Port Royale Ln
- 9420 W Shiprock Dr Unit 25
- 9325 W Arrowhead Dr
- 9429 W Rolling Hills Dr
- 9430 W Arrowhead Dr
- 9434 W Raintree Dr
- 14618 N Shiprock Dr
- 14830 N Cameo Dr
- 8849 W Port Royale Ln
- 9139 W Crocus Dr
- 9134 W Watson Ln
- 9140 W Watson Ln
- 9145 W Crocus Dr
- 14255 N 91st Ln
- 9134 W Crocus Dr
- 14245 N 91st Ln
- 9140 W Crocus Dr
- 9146 W Watson Ln
- 14305 N 91st Ln
- 14235 N 91st Ln
- 9146 W Crocus Dr
- 9151 W Crocus Dr
- 14315 N 91st Ln
- 14254 N 91st Dr
- 9133 W Gelding Dr
- 14244 N 91st Dr
- 9152 W Watson Ln
- 9139 W Gelding Dr
- 14304 N 91st Dr