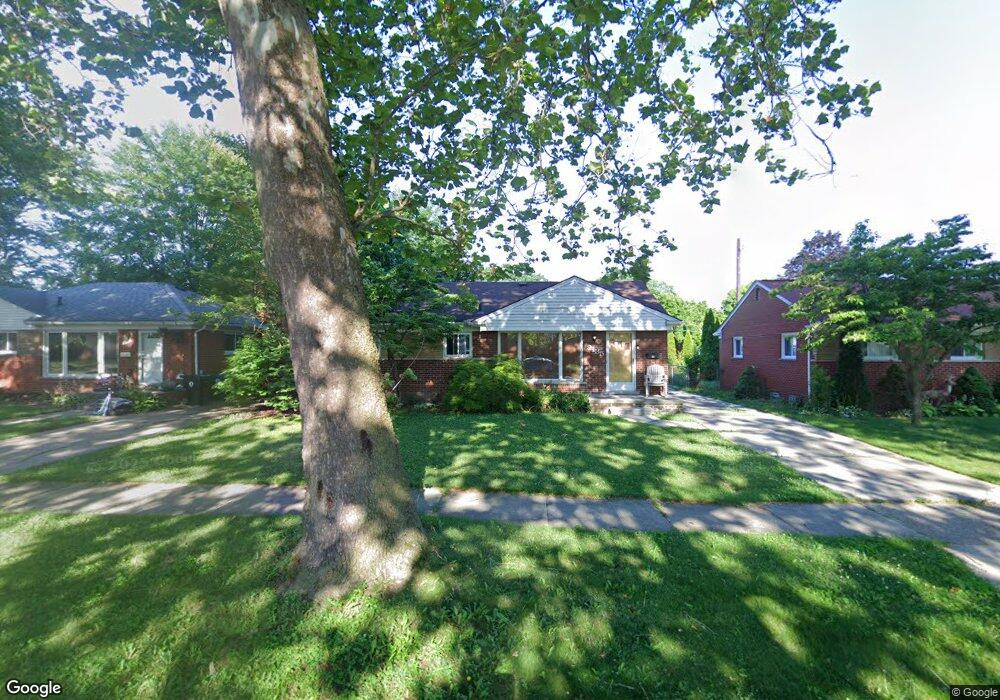
9135 Nathaline Redford, MI 48239
Estimated Value: $206,585 - $275,000
--
Bed
1
Bath
1,112
Sq Ft
$212/Sq Ft
Est. Value
About This Home
This home is located at 9135 Nathaline, Redford, MI 48239 and is currently estimated at $235,896, approximately $212 per square foot. 9135 Nathaline is a home located in Wayne County with nearby schools including John D. Pierce Middle School, Lee M. Thurston High School, and Westfield Charter Academy.
Ownership History
Date
Name
Owned For
Owner Type
Purchase Details
Closed on
Dec 29, 2016
Sold by
Mortgage Cnter Title Llc
Bought by
Jd Investment Llc
Current Estimated Value
Purchase Details
Closed on
Nov 19, 2014
Sold by
Dandnaik Parthiv
Bought by
Jd Investment Llc
Purchase Details
Closed on
Oct 30, 2014
Sold by
Sims Darren A
Bought by
Community Financial Credit Union
Purchase Details
Closed on
Jul 17, 2014
Sold by
Sims Darren A
Bought by
Dandnaik Parthir
Purchase Details
Closed on
Jan 13, 1998
Sold by
Davis Nancy Bridgeman
Bought by
Sims Darren A
Create a Home Valuation Report for This Property
The Home Valuation Report is an in-depth analysis detailing your home's value as well as a comparison with similar homes in the area
Home Values in the Area
Average Home Value in this Area
Purchase History
| Date | Buyer | Sale Price | Title Company |
|---|---|---|---|
| Jd Investment Llc | $80,000 | Mortgage Center Title Llc | |
| Jd Investment Llc | -- | None Available | |
| Community Financial Credit Union | $66,188 | None Available | |
| Dandnaik Parthir | $24,209 | None Available | |
| Sims Darren A | $116,000 | -- |
Source: Public Records
Tax History Compared to Growth
Tax History
| Year | Tax Paid | Tax Assessment Tax Assessment Total Assessment is a certain percentage of the fair market value that is determined by local assessors to be the total taxable value of land and additions on the property. | Land | Improvement |
|---|---|---|---|---|
| 2025 | $1,379 | $101,800 | $0 | $0 |
| 2024 | $1,379 | $95,400 | $0 | $0 |
| 2023 | $1,318 | $83,900 | $0 | $0 |
| 2022 | $3,427 | $74,900 | $0 | $0 |
| 2021 | $3,762 | $71,200 | $0 | $0 |
| 2020 | $3,468 | $63,900 | $0 | $0 |
| 2019 | $3,212 | $56,100 | $0 | $0 |
| 2018 | $1,176 | $46,700 | $0 | $0 |
| 2017 | $3,567 | $44,200 | $0 | $0 |
| 2016 | $2,918 | $39,700 | $0 | $0 |
| 2015 | $3,540 | $35,400 | $0 | $0 |
| 2013 | $2,980 | $30,500 | $0 | $0 |
| 2012 | $1,953 | $33,100 | $7,800 | $25,300 |
Source: Public Records
Map
Nearby Homes