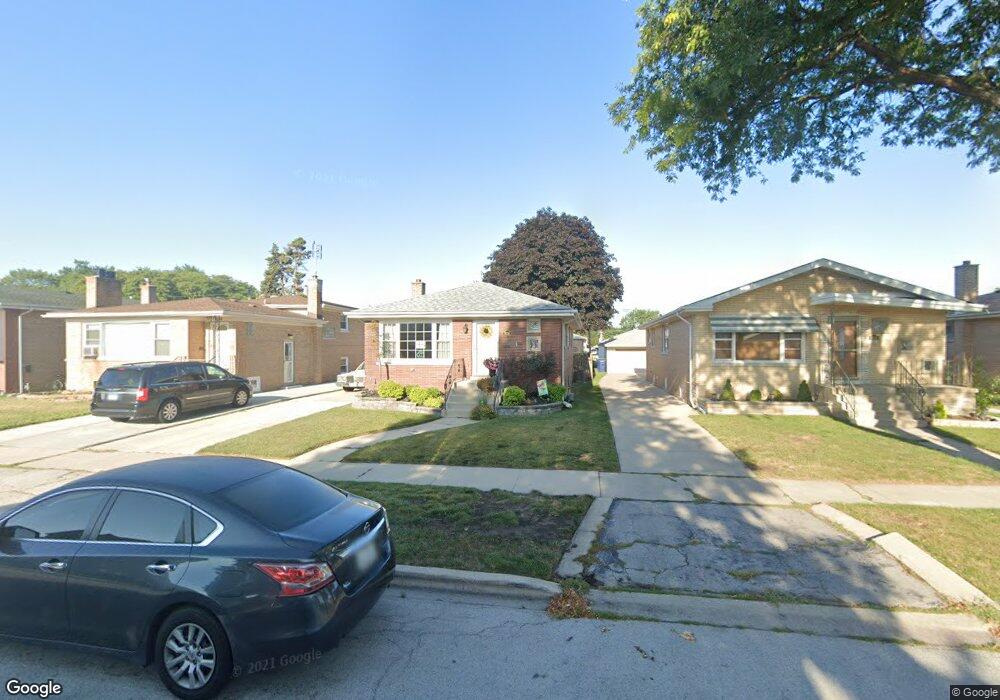
9136 S Saint Louis Ave Evergreen Park, IL 60805
Estimated Value: $286,000 - $311,000
3
Beds
2
Baths
1,112
Sq Ft
$269/Sq Ft
Est. Value
About This Home
This home is located at 9136 S Saint Louis Ave, Evergreen Park, IL 60805 and is currently estimated at $298,795, approximately $268 per square foot. 9136 S Saint Louis Ave is a home located in Cook County with nearby schools including Northwest Elementary School, Central Jr High School, and Evergreen Park High School.
Ownership History
Date
Name
Owned For
Owner Type
Purchase Details
Closed on
Aug 1, 2005
Sold by
Cahill Jane A
Bought by
Cahill Rhineberger Jane A
Current Estimated Value
Home Financials for this Owner
Home Financials are based on the most recent Mortgage that was taken out on this home.
Original Mortgage
$184,831
Interest Rate
6.38%
Mortgage Type
FHA
Purchase Details
Closed on
Aug 26, 2002
Sold by
Teuber Jonathan and Teuber Fionnuala R
Bought by
Cahill Jane A
Home Financials for this Owner
Home Financials are based on the most recent Mortgage that was taken out on this home.
Original Mortgage
$152,600
Interest Rate
6.56%
Mortgage Type
FHA
Purchase Details
Closed on
Jul 15, 1996
Sold by
Morande Thomas G and Morande Julie A
Bought by
Fox Fionnuala R and Teuber Jonathan P
Home Financials for this Owner
Home Financials are based on the most recent Mortgage that was taken out on this home.
Original Mortgage
$128,010
Interest Rate
8.33%
Create a Home Valuation Report for This Property
The Home Valuation Report is an in-depth analysis detailing your home's value as well as a comparison with similar homes in the area
Home Values in the Area
Average Home Value in this Area
Purchase History
| Date | Buyer | Sale Price | Title Company |
|---|---|---|---|
| Cahill Rhineberger Jane A | -- | Lawyers Title Insurance Corp | |
| Cahill Jane A | $155,000 | Chicago Title Insurance Co | |
| Fox Fionnuala R | $130,000 | -- |
Source: Public Records
Mortgage History
| Date | Status | Borrower | Loan Amount |
|---|---|---|---|
| Previous Owner | Cahill Rhineberger Jane A | $184,831 | |
| Previous Owner | Cahill Jane A | $152,600 | |
| Previous Owner | Fox Fionnuala R | $128,010 |
Source: Public Records
Tax History Compared to Growth
Tax History
| Year | Tax Paid | Tax Assessment Tax Assessment Total Assessment is a certain percentage of the fair market value that is determined by local assessors to be the total taxable value of land and additions on the property. | Land | Improvement |
|---|---|---|---|---|
| 2024 | $6,036 | $19,036 | $3,724 | $15,312 |
| 2023 | $4,864 | $21,000 | $3,724 | $17,276 |
| 2022 | $4,864 | $15,713 | $3,192 | $12,521 |
| 2021 | $4,734 | $15,712 | $3,192 | $12,520 |
| 2020 | $4,641 | $15,712 | $3,192 | $12,520 |
| 2019 | $5,442 | $17,443 | $2,926 | $14,517 |
| 2018 | $5,331 | $17,443 | $2,926 | $14,517 |
| 2017 | $5,265 | $17,443 | $2,926 | $14,517 |
| 2016 | $4,899 | $14,872 | $2,394 | $12,478 |
| 2015 | $4,859 | $14,872 | $2,394 | $12,478 |
| 2014 | $4,763 | $14,872 | $2,394 | $12,478 |
| 2013 | $4,801 | $16,070 | $2,394 | $13,676 |
Source: Public Records
Map
Nearby Homes
- 9117 S Clifton Park Ave
- 9100 S Saint Louis Ave
- 9210 S Trumbull Ave
- 9240 S Trumbull Ave
- 9314 S Central Park Ave
- 9227 S Turner Ave
- 9146 S Spaulding Ave
- 9322 S Trumbull Ave
- 9412 S Homan Ave
- 9319 S Ridgeway Ave
- 9252 S Sawyer Ave
- 9427 S Saint Louis Ave
- 9100 S Kedzie Ave
- 9338 S Ridgeway Ave
- 9250 S Kedzie Ave
- 9431 S Turner Ave
- 9451 S Lawndale Ave
- 9148 S Troy Ave
- 9321 S Avers Ave
- 9258 S Albany Ave
- 9132 S Saint Louis Ave
- 9140 S Saint Louis Ave
- 9128 S Saint Louis Ave
- 9144 S Saint Louis Ave
- 9124 S Saint Louis Ave
- 9148 S Saint Louis Ave
- 9137 S Clifton Park Ave
- 9141 S Clifton Park Ave
- 9133 S Clifton Park Ave
- 9145 S Clifton Park Ave
- 9129 S Clifton Park Ave
- 9120 S Saint Louis Ave
- 9152 S Saint Louis Ave
- 9149 S Clifton Park Ave
- 9125 S Clifton Park Ave
- 9145 S St Louis Ave
- 9137 S Saint Louis Ave
- 9116 S Saint Louis Ave
- 9133 S Saint Louis Ave
- 9141 S Saint Louis Ave