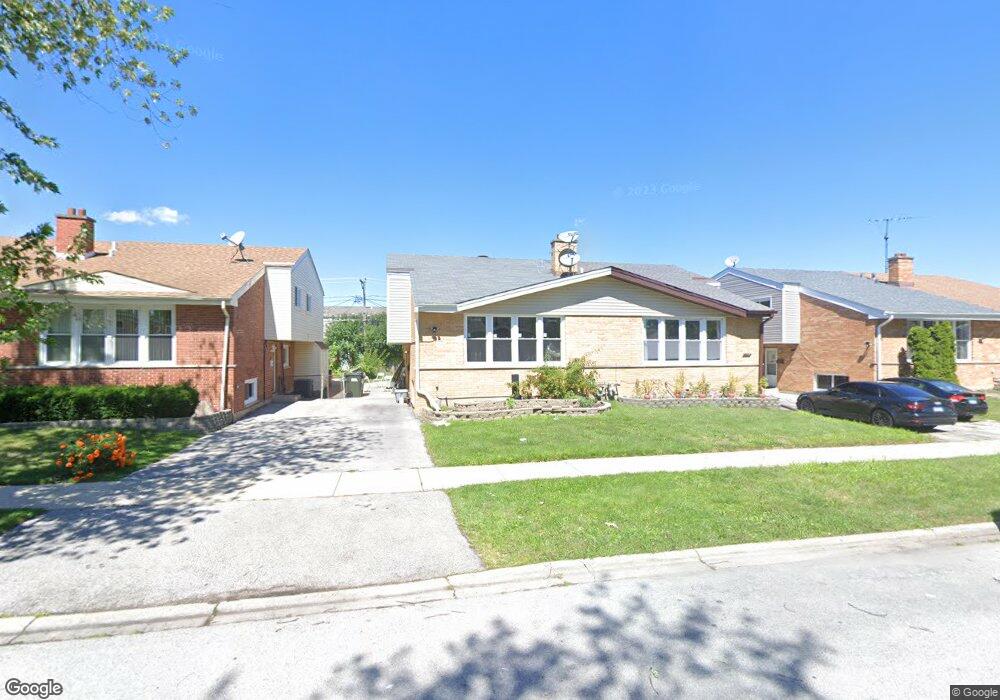
9138 Barberry Ln Des Plaines, IL 60016
Estimated Value: $376,396 - $394,000
3
Beds
2
Baths
1,777
Sq Ft
$216/Sq Ft
Est. Value
About This Home
This home is located at 9138 Barberry Ln, Des Plaines, IL 60016 and is currently estimated at $384,349, approximately $216 per square foot. 9138 Barberry Ln is a home located in Cook County with nearby schools including Mark Twain Elementary School, Gemini Middle School, and Maine East High School.
Ownership History
Date
Name
Owned For
Owner Type
Purchase Details
Closed on
Dec 12, 2007
Sold by
Baroota Fovad and Baroota Hala
Bought by
Baroota Fovad and Baroota Hala
Current Estimated Value
Home Financials for this Owner
Home Financials are based on the most recent Mortgage that was taken out on this home.
Original Mortgage
$215,000
Outstanding Balance
$133,030
Interest Rate
5.87%
Mortgage Type
New Conventional
Estimated Equity
$251,319
Purchase Details
Closed on
May 30, 1997
Sold by
Kravchenko Yuriy and Kravchenko Stella
Bought by
Vakkel Esthappan and Esthappan Annamma
Home Financials for this Owner
Home Financials are based on the most recent Mortgage that was taken out on this home.
Original Mortgage
$117,600
Interest Rate
8.17%
Create a Home Valuation Report for This Property
The Home Valuation Report is an in-depth analysis detailing your home's value as well as a comparison with similar homes in the area
Home Values in the Area
Average Home Value in this Area
Purchase History
| Date | Buyer | Sale Price | Title Company |
|---|---|---|---|
| Baroota Fovad | -- | Ticor Title Insurance Co | |
| Vakkel Esthappan | $147,000 | -- |
Source: Public Records
Mortgage History
| Date | Status | Borrower | Loan Amount |
|---|---|---|---|
| Open | Baroota Fovad | $215,000 | |
| Closed | Vakkel Esthappan | $117,600 |
Source: Public Records
Tax History Compared to Growth
Tax History
| Year | Tax Paid | Tax Assessment Tax Assessment Total Assessment is a certain percentage of the fair market value that is determined by local assessors to be the total taxable value of land and additions on the property. | Land | Improvement |
|---|---|---|---|---|
| 2024 | $7,231 | $29,997 | $4,997 | $25,000 |
| 2023 | $6,850 | $29,997 | $4,997 | $25,000 |
| 2022 | $6,850 | $29,997 | $4,997 | $25,000 |
| 2021 | $5,208 | $19,916 | $3,131 | $16,785 |
| 2020 | $5,157 | $19,916 | $3,131 | $16,785 |
| 2019 | $5,045 | $22,129 | $3,131 | $18,998 |
| 2018 | $4,993 | $19,671 | $2,739 | $16,932 |
| 2017 | $4,942 | $19,671 | $2,739 | $16,932 |
| 2016 | $4,860 | $19,671 | $2,739 | $16,932 |
| 2015 | $4,267 | $16,428 | $2,348 | $14,080 |
| 2014 | $4,134 | $16,428 | $2,348 | $14,080 |
| 2013 | $4,049 | $16,428 | $2,348 | $14,080 |
Source: Public Records
Map
Nearby Homes
- 9128 Hollyberry Ave
- 9209 Potter Rd Unit 2F
- 9446 Dee Rd Unit 2F
- 9460 Terrace Place
- 9501 Terrace Place
- 9561 Dee Rd Unit 1D
- 9561 Dee Rd Unit 2D
- 9256 N Parkside Dr
- 9407 Ironwood Ln
- 8999 Kennedy Dr Unit 1B
- 9588 Terrace Place Unit 1C
- 9001 Golf Rd Unit 5B
- 9413 Meadow Ln
- 9454 Potter Rd
- 9355 Landings Ln Unit 406
- 9332 Landings Ln Unit 504
- 9276 N Western Ave
- 8904 Robin Dr
- 481 Edward Ct
- 9009 Golf Rd Unit 2A
- 9144 Barberry Ln
- 9134 Barberry Ln
- 9128 Barberry Ln
- 9154 Barberry Ln
- 9124 Barberry Ln
- 9125 W Oaks Ave
- 9121 W Oaks Ave
- 9129 W Oaks Ave
- 9117 W Oaks Ave
- 9133 W Oaks Ave
- 9118 Barberry Ln
- 9156 Barberry Ln
- 9113 W Oaks Ave
- 9137 W Oaks Ave
- 9109 W Oaks Ave
- 9162 Barberry Ln
- 9129 Barberry Ln
- 9133 Barberry Ln
- 9125 Barberry Ln