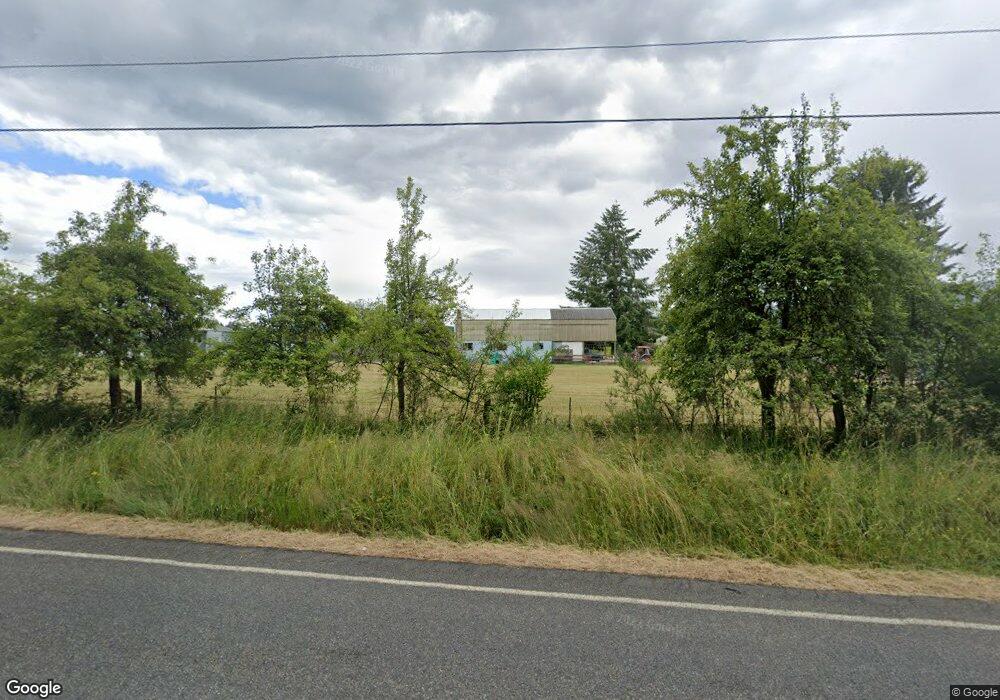
9139 Delphi Rd SW Olympia, WA 98512
Estimated Value: $678,000 - $728,247
3
Beds
2
Baths
2,112
Sq Ft
$331/Sq Ft
Est. Value
About This Home
This home is located at 9139 Delphi Rd SW, Olympia, WA 98512 and is currently estimated at $698,312, approximately $330 per square foot. 9139 Delphi Rd SW is a home located in Thurston County with nearby schools including Littlerock Elementary School, George Washington Bush Middle School, and Tumwater High School.
Ownership History
Date
Name
Owned For
Owner Type
Purchase Details
Closed on
Oct 1, 2004
Sold by
Parsons Charles and Parsons Judith
Bought by
Ferguson Kenneth K and Ferguson Rebecca L
Current Estimated Value
Home Financials for this Owner
Home Financials are based on the most recent Mortgage that was taken out on this home.
Original Mortgage
$77,200
Interest Rate
5.76%
Mortgage Type
Seller Take Back
Purchase Details
Closed on
Feb 25, 2000
Sold by
Parsons Charles and Parsons Judith
Bought by
Ferguson Kenneth and Ferguson Rebecca
Home Financials for this Owner
Home Financials are based on the most recent Mortgage that was taken out on this home.
Original Mortgage
$82,000
Interest Rate
8%
Create a Home Valuation Report for This Property
The Home Valuation Report is an in-depth analysis detailing your home's value as well as a comparison with similar homes in the area
Home Values in the Area
Average Home Value in this Area
Purchase History
| Date | Buyer | Sale Price | Title Company |
|---|---|---|---|
| Ferguson Kenneth K | -- | Thurston County Title | |
| Ferguson Kenneth | $82,000 | First American Title Ins Co |
Source: Public Records
Mortgage History
| Date | Status | Borrower | Loan Amount |
|---|---|---|---|
| Closed | Ferguson Kenneth K | $77,200 | |
| Previous Owner | Ferguson Kenneth | $82,000 |
Source: Public Records
Tax History Compared to Growth
Tax History
| Year | Tax Paid | Tax Assessment Tax Assessment Total Assessment is a certain percentage of the fair market value that is determined by local assessors to be the total taxable value of land and additions on the property. | Land | Improvement |
|---|---|---|---|---|
| 2024 | $6,737 | $671,600 | $265,500 | $406,100 |
| 2023 | $6,737 | $641,500 | $257,600 | $383,900 |
| 2022 | $6,182 | $618,700 | $198,800 | $419,900 |
| 2021 | $6,160 | $491,900 | $155,800 | $336,100 |
| 2020 | $5,675 | $441,500 | $144,800 | $296,700 |
| 2019 | $5,383 | $391,700 | $167,300 | $224,400 |
| 2018 | $5,319 | $378,600 | $126,500 | $252,100 |
| 2017 | $4,990 | $352,650 | $125,350 | $227,300 |
| 2016 | $5,185 | $345,250 | $123,850 | $221,400 |
| 2014 | -- | $361,600 | $128,800 | $232,800 |
Source: Public Records
Map
Nearby Homes
- 5815 95th Ave SW
- 8747 Laguna Dr SW
- 8107 Mazama Ct SW
- 7940 Thornburg St SW
- 5206 81st Ave SW
- 5325 79th Ct SW
- 7734 Greenridge St SW
- 5336 75th Ct SW
- 7524 Greenridge St SW
- 7620 Sprucecrest St SW
- 10918 Creekwood Dr SW
- 7615 Sprucecrest St SW
- 9241 Littlerock Rd SW
- 4315 88th Ave SW
- 6819 Northill Dr SW
- 7844 Delphi Rd SW
- 0 Brown Rd SW
- 7605 Lakeside St SW
- 7609 Lakeside St SW
- 7207 Lakeside St SW
- 9143 Delphi Rd SW
- 9141 Delphi Rd SW
- 9021 Delphi Rd SW
- 9210 Delphi Rd SW
- 9329 Delphi Rd SW
- 9327 Delphi Rd SW
- 9291 Delphi Rd SW
- 9411 Delphi Rd SW
- 9140 Delphi Rd SW
- 9333 Delphi Rd SW
- 6210 95th Ave SW
- 9212 Delphi Rd SW
- 9407 Delphi Rd SW
- 6330 95th Ave SW
- 9415 Delphi Rd SW
- 9419 Delphi Rd SW
- 9429 Delphi Rd SW
- 9425 Delphi Rd SW
- 9427 Delphi Rd SW
- 6220 95th Ave SW